
Page 79 - TD-4-2
P. 79
Tumor Discovery DRGs in HCC prognosis and immunity
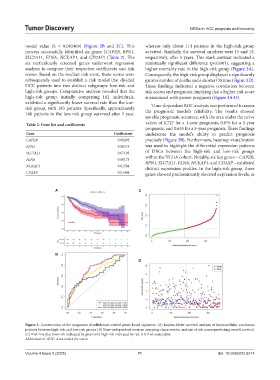
model value (λ = 0.082469) (Figure 2B and 2C). This whereas only about 114 patients in the high-risk group
process successfully identified six genes (CAPZB, RPN1, survived. Similarly, the survival numbers were 15 and 13,
SLC7A11, FLNA, NCKAP1, and CD2AP) (Table 2). The respectively, after 5 years. This stark contrast indicated a
six meticulously screened genes underwent regression statistically significant difference (p<0.001), suggesting a
analysis to compute their respective coefficients and risk higher mortality rate in the high-risk group (Figure 3A).
scores. Based on the median risk score, these scores were Consequently, the high-risk group displayed a significantly
subsequently used to establish a risk model that divided greater number of deaths and a shorter OS time (Figure 3D).
HCC patients into two distinct subgroups: low-risk and These findings indicated a negative correlation between
high-risk groups. Comparative analysis revealed that the risk scores and prognosis, implying that a higher risk score
high-risk group, initially comprising 182 individuals, is associated with poorer prognosis (Figure 3A-D).
exhibited a significantly lower survival rate than the low- Time-dependent ROC analysis was performed to assess
risk group, with 183 patients. Specifically, approximately
140 patients in the low-risk group survived after 1 year, the prognostic model’s reliability. The results showed
notable prognostic accuracy, with the area under the curve
Table 2. Gene list and coefficients values of 0.727 for a 1-year prognosis, 0.676 for a 3-year
prognosis, and 0.635 for a 5-year prognosis. These findings
Gene Coefficients underscore the model’s ability to predict prognosis
CAPZB 0.00295 precisely (Figure 3B). Furthermore, heatmap visualization
RPN1 0.00575 was used to highlight the differential expression patterns
SLC7A11 0.07195 of DRGs between the high-risk and low-risk groups
FLNA 0.00173 within the TCGA cohort. Notably, six key genes – CAPZB,
RPN1, SLC7A11, FLNA, NCKAP1, and CD2AP – exhibited
NCKAP1 0.01584 distinct expression profiles. In the high-risk group, these
CD2AP 0.01404 genes showed predominantly elevated expression levels, as
A C
B
D
Figure 3. Construction of the prognostic disulfidptosis-related genes-based signature. (A) Kaplan-Meier survival analysis of hepatocellular carcinoma
patients between high-risk and low-risk groups (B) Time-independent receiver operating characteristic analysis of risk scores predicting overall survival.
(C) Risk line plot (low risk indicated by green and high risk indicated by red. (D) Risk scatterplot.
Abbreviation: AUC: Area under the curve.
Volume 4 Issue 2 (2025) 71 doi: 10.36922/td.8214