
Page 82 - TD-4-2
P. 82
Tumor Discovery DRGs in HCC prognosis and immunity
A B
C D
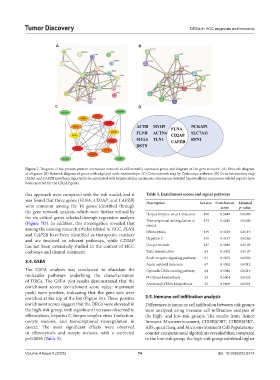
Figure 7. Diagram of the protein-protein interaction network of differentially expressed genes and diagram of the gene network. (A) Network diagram
of all genes. (B) Network diagram of genes with edge and node relationships. (C) Gene network map by Cystoscope software. (D) Gene intersection map
(FLNA and CAPZB have been reported to be associated with hepatocellular carcinoma, whereas no detailed hepatocellular carcinoma-related reports have
been reported for the CD2AP gene).
this approach were compared with the risk model, and it Table 3. Enrichment scores and signal pathways
was found that three genes (FLNA, CD2AP, and CAPZB) Description Set size Enrichment Adjusted
were common among the 10 genes identified through score p-value
the gene network analysis, which were further refined by Herpes simplex virus 1 infection 498 0.3849 0.0380
the six critical genes selected through regression analysis
(Figure 7D). In addition, this investigation revealed that Transcriptional misregulation in 173 0.4245 0.0400
cancer
among the existing research articles related to HCC, FLNA Efferocytosis 149 0.4529 0.0119
and CAPZB have been identified as therapeutic markers
and are involved in relevant pathways, while CD2AP Hepatitis C 149 0.4437 0.0260
has not been extensively studied in the context of HCC Oocyte meiosis 127 0.4689 0.0105
pathways and clinical treatment. Taste transduction 83 0.4902 0.0107
B cell receptor signaling pathway 81 0.4875 0.0260
3.4. GSEA
Acute myeloid leukemia 67 0.4902 0.0312
The GSEA analysis was conducted to elucidate the Cytosolic DNA-sensing pathway 64 0.5040 0.0219
molecular pathways underlying the characterization N-Glycan biosynthesis 53 0.5001 0.0433
of DRGs. The GSEA plot results demonstrated that the Aminoacyl-tRNA biosynthesis 25 0.5809 0.0324
enrichment scores (enrichment score value: maximum
peak) were positive, indicating that the gene sets were
enriched at the top of the list (Figure S5). These positive 3.5. Immune cell infiltration analysis
enrichment scores suggest that the DRGs were elevated in Differences in immune cell infiltration between risk groups
the high-risk group, with significant increases observed in were analyzed using immune cell infiltration analyses of
efferocytosis, hepatitis C, herpes simplex virus 1 infection, the high- and low-risk groups. The results from Tumor
oocyte meiosis, and transcriptional misregulation in Immune Microenvironment, CIBERSORT, CIBERSORT-
cancer. The most significant effects were observed ABS, quanTIseq, and Microenvironment Cell Populations-
in efferocytosis and oocyte meiosis, with a corrected counter computational algorithms revealed that, compared
p=0.0096 (Table 3). to the low-risk group, the high-risk group exhibited higher
Volume 4 Issue 2 (2025) 74 doi: 10.36922/td.8214