
Page 78 - TD-4-2
P. 78
Tumor Discovery DRGs in HCC prognosis and immunity
tissues, which is crucial for elucidating tumorigenesis, NCKAP1, CD2AP, ACTB, and ACTN4) exhibited
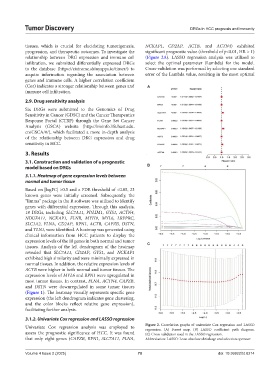
progression, and therapeutic outcomes. To investigate the significant prognostic value (threshold of p<0.01, HR > 1)
relationship between DRG expression and immune cell (Figure 2A). LASSO regression analysis was utilized to
infiltration, we submitted differentially expressed DRGs select the optimal parameter (Lambda) for the model.
to the database (https://cistrome.shinyapps.io/timer/) to Cross-validation was performed by selecting one standard
acquire information regarding the association between error of the Lambda value, resulting in the most optimal
genes and immune cells. A higher correlation coefficient
(Cor) indicates a stronger relationship between genes and A
immune cell infiltration.
2.9. Drug sensitivity analysis
Six DRGs were submitted to the Genomics of Drug
Sensitivity in Cancer (GDSC) and the Cancer Therapeutics
Response Portal (CTRP) through the Gene Set Cancer
Analysis (GSCA) website (http://bioinfo.life.hust.edu.
cn/GSCA/#/), which facilitated a more in-depth analysis
of the relationship between DRG expression and drug
sensitivity in HCC.
3. Results
3.1. Construction and validation of a prognostic
model based on DRGs B
3.1.1. Heatmap of gene expression levels between
normal and tumor tissue
Based on |logFC| >0.5 and a FDR threshold of <0.05, 23
known genes were initially screened. Subsequently, the
“limma” package in the R software was utilized to identify
genes with differential expression. Through this analysis,
18 DRGs, including SLC7A11, PDLIM1, GYS1, ACTN4,
NDUFA11, NCKAP1, FLNB, MYH9, MYL6, LRPPRC,
SLC3A2, FLNA, CD2AP, RPN1, ACTB, CAPZB, DSTN,
and TLN1, were identified. A heatmap was generated using
clinical information from HCC patients to display the
expression levels of the 18 genes in both normal and tumor
tissues. Analysis of the left dendrogram of the heatmap C
revealed that SLC7A11, CD2AP, GYS1, and NCKAP1
exhibited high similarity and were minimally expressed in
normal tissues. In addition, the relative expression levels of
ACTB were higher in both normal and tumor tissues. The
expression levels of MYL6 and RPN1 were upregulated in
most tumor tissues. In contrast, FLNA, ACTN4, CAPZB,
and DSTN were downregulated in some tumor tissues
(Figure 1). The heatmap visually represents specific gene
expression (the left dendrogram indicates gene clustering,
and the color blocks reflect relative gene expression),
facilitating further analysis.
3.1.2. Univariate Cox regression and LASSO regression
Univariate Cox regression analysis was employed to Figure 2. Correlation graphs of univariate Cox regression and LASSO
regression. (A) Forest map. (B) LASSO coefficient path diagram.
assess the prognostic significance of HCC. It was found (C) Cross-validation used in the LASSO regression.
that only eight genes (CAPZB, RPN1, SLC7A11, FLNA, Abbreviation: LASSO: Least absolute shrinkage and selection operator.
Volume 4 Issue 2 (2025) 70 doi: 10.36922/td.8214