
Page 83 - TD-4-2
P. 83
Tumor Discovery DRGs in HCC prognosis and immunity
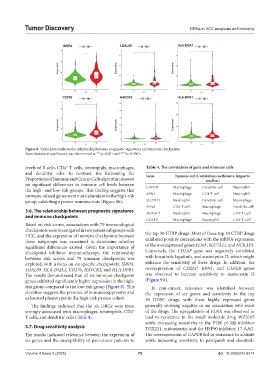
Figure 8. Violin plots indicate the relationship between prognostic signatures and immune checkpoints
Note: Statistical significance was determined at ***p<0.001 and ****p<0.0001.
+
levels of B cells, CD4 T cells, neutrophils, macrophages, Table 4. The correlation of gene and immune cells
and dendritic cells. In contrast, the Estimating the Gene Immune cell (Correlation coefficients: largest to
Proportions of Immune and Cancer Cells algorithm showed smallest)
no significant differences in immune cell levels between CAPZB Macrophage Dendritic cell Neutrophil
the high- and low-risk groups. This finding suggests that +
immune-related genes were more abundant in the high-risk RPN1 Macrophage CD4 T cell Neutrophil
group, exhibiting a poorer immune state (Figure S6). SLC7A11 Neutrophil Dendritic cell Macrophage
FLNA CD4 T cell Macrophage Dendritic cell
+
3.6. The relationship between prognostic signatures NCKAP1 Neutrophil Macrophage CD4 T Cell
+
and immune checkpoints
CD2AP Macrophage Neutrophil CD4 T Cell
+
Based on risk scores, associations with 79 immunological
checkpoints were investigated in two patient subgroups with the top 30 CTRP drugs. Most of these top 30 CTRP drugs
HCC, and the expression of immune checkpoints between exhibited positive correlations with the mRNA expression
these subgroups was examined to determine whether
significant differences existed. Given the importance of of the overexpressed genes FLNA, SLC7A11, and NCKAP1.
checkpoint inhibitor immunotherapy, the relationship Conversely, the CD2AP gene was negatively correlated
between risk scores and 79 immune checkpoints was with bosutinib, lapatinib, and austocystin D, which might
explored, with a focus on six specific checkpoints: SIRPA, enhance the sensitivity of these drugs. In addition, the
LGALS9, HLA-DQA1, CD276, HAVCR2, and HLA-DPB1. overexpression of CD2AP, RPN1, and CAPZB genes
The results demonstrated that all six immune checkpoint was observed to increase sensitivity to austocystin D
genes exhibited significantly higher expression in the high- (Figure 9A).
risk group compared to the low-risk group (Figure 8). This In pan-cancer, relevance was identified between
elevation suggests the presence of immunosuppressive and the expression of six genes and sensitivity to the top
exhausted phenotypes in the high-risk patient cohort. 30 GDSC drugs, with these highly expressed genes
The findings indicated that the six DRGs were most generally showing negative or no association with most
strongly associated with macrophages, neutrophils, CD4 + of the drugs. The upregulation of FLNA was observed to
T cells, and dendritic cells (Table 4). lead to resistance to the small molecule drug WZ3105
while increasing sensitivity to the PI3K p110β inhibitor
3.7. Drug sensitivity analysis TGX221, midostaurin, and the HSP90 inhibitor, 17-AAG.
The results indicated relevance between the expression of The overexpression of CAPZB led to resistance to afatinib
six genes and the susceptibility of pan-cancer patients to while increasing sensitivity to pazopanib and dasatinib.
Volume 4 Issue 2 (2025) 75 doi: 10.36922/td.8214