
Page 84 - TD-4-2
P. 84
Tumor Discovery DRGs in HCC prognosis and immunity
A
B
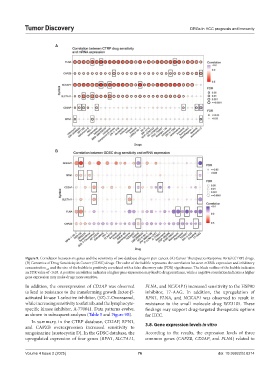
Figure 9. Correlation between six genes and the sensitivity of two database drugs in pan-cancer. (A) Cancer Therapeutics Response Portal (CTRP) drugs.
(B) Genomics of Drug Sensitivity in Cancer (GDSC) drugs. The color of the bubble represents the correlation between mRNA expression and inhibitory
concentration , and the size of the bubble is positively correlated with a false discovery rate (FDR) significance. The black outline of the bubble indicates
50
an FDR value of <0.05. A positive correlation indicates a higher gene expression may lead to drug resistance, while a negative correlation indicates a higher
gene expression may make drugs more sensitive.
In addition, the overexpression of CD2AP was observed FLNA, and NCKAP1) increased sensitivity to the HSP90
to lead to resistance to the transforming growth factor-β- inhibitor, 17-AAG. In addition, the upregulation of
activated kinase 1-selective inhibitor, (5Z)-7-Oxozeaenol, RPN1, FLNA, and NCKAP1 was observed to result in
while increasing sensitivity to afatinib, and the lymphocyte- resistance to the small molecule drug WZ3105. These
specific kinase inhibitor, A-770041. Data patterns evolve, findings may support drug-targeted therapeutic options
as shown in subsequent analyses (Table 5 and Figure 9B). for HCC.
In summary, in the CTRP database, CD2AP, RPN1,
and CAPZB overexpression increased sensitivity to 3.8. Gene expression levels in vitro
sanguinarine (austocystin D). In the GDSC database, the According to the results, the expression levels of three
upregulated expression of four genes (RPN1, SLC7A11, common genes (CAPZB, CD2AP, and FLNA) related to
Volume 4 Issue 2 (2025) 76 doi: 10.36922/td.8214