
Page 125 - AIH-1-3
P. 125
Artificial Intelligence in Health Interpretability of deep models for COVID-19
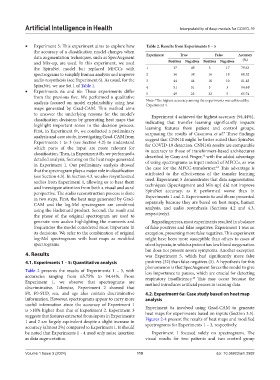
• Experiment 5: This experiment aims to explore how Table 2. Results from Experiments 1 – 5
the accuracy of a classification model changes when
data augmentation techniques, such as SpecAugment Experiment True False Accuracy
(%)
and Mix-up, are used. In this experiment, we used Positives Negatives Positives Negatives
the SpiraNet model but replaced MFCCs with 1 37 49 5 17 79.63
spectrograms to simplify human analysis and improve 2 36 38 16 18 68.52
audio resynthesis (see Experiment 6). As usual, for the 3 44 44 10 10 81.48
SpiraNet, we use Set 1 of Table 1. 4 51 51 3 3 94.44 a
• Experiments 6a and 6b: These experiments differ 5 49 22 32 5 65.74
from the previous five. We performed a qualitative
a
analysis focused on model explainability using heat Note: The highest accuracy among the experiments was achieved by
Experiment 4.
maps generated by Grad-CAM. This method aims
to uncover the underlying reasons for the model’s Experiment 4 achieved the highest accuracy (94.44%),
classification decisions by generating heat maps that indicating that transfer learning significantly impacts
highlight important zones in the decision process. learning features from patient and control groups,
First, in Experiment 6ª, we conducted a preliminary surpassing the results of Casanova et al. These findings
9
analysis and case study, investigating Grad-CAM from suggest that CNN14 might be better suited than SpiraNet
Experiments 1 to 3 (see Section 4.2) to understand for COVID-19 detection. CNN14’s results are comparable
which parts of the input are more relevant for in accuracy to those of transformers-based architectures
classification. Then, in Experiment 6b, we performed a described by Gauy and Finger, with the added advantage
12
detailed analysis, focusing on the heat maps generated of using spectrograms as input instead of MFCCs, as was
in Experiment 1. Our preliminary analysis showed the case for the MFCC-transformer. This advantage is
12
that the spectrogram plays a major role in classification attributed to the effectiveness of the transfer learning
(see Section 4.3). In Section 4.3, we also resynthesized
audios from Experiment 1, allowing us to hear them used. Experiment 5 demonstrates that data augmentation
and investigate attention from both a visual and aural techniques (SpecAugment and Mix-up) did not improve
perspective. The audio reconstruction process is done SpiraNet accuracy, as it performed worse than in
in two steps. First, the heat map generated by Grad- Experiments 1 and 2. Experiments 6a and 6b are presented
CAM and the log-Mel spectrogram are combined separately because they are based on heat maps, human
using the Hadamard product. Second, the result and analysis, and audio resynthesis (Sections 4.2 and 4.3,
the phase of the original spectrogram are used to respectively).
generate new audios highlighting the moments and Regarding errors, most experiments resulted in a balance
frequencies the model considered most important in of false positives and false negatives. Experiment 1 was an
its decisions. We refer to the combination of original exception, presenting more false negatives. This experiment
log-Mel spectrograms with heat maps as modified might have been more susceptible than others to cases of
spectrograms. silent hypoxia, in which a patient has low blood oxygenation
but does not present severe symptoms. Another exception
4. Results was Experiment 5, which had significantly more false
4.1. Experiments 1 – 5: Quantitative analysis positives (32) than false negatives (5). A hypothesis for this
phenomenon is that SpecAugment forces the model to give
Table 2 presents the results of Experiments 1 – 5, with less importance to pauses, which are crucial for detecting
accuracies ranging from 65.75% to 94.44%. From respiratory insufficiency. This may occur because the
18
Experiment 1, we observe that spectrograms are method introduces artificial pauses in training data.
discriminative. Likewise, Experiment 2 showed that
F0, F0-STD, sex, and age also contain discriminative 4.2. Experiment 6a: Case study based on heat map
information. However, spectrograms appear to carry more analysis
useful information since the accuracy of Experiment 1 Experiment 6a involved using Grad-CAM to generate
is >10% higher than that of Experiment 2. Experiment 3 heat maps for experiments based on inputs (Section 3.5).
suggests that features extracted from inputs in Experiments Figures 2-4 present the results of heat maps and modified
1 and 2 are largely equivalent despite a slight increase in
accuracy (almost 2%) compared to Experiment 1. It should spectrograms for Experiments 1 – 3, respectively.
be noted that Experiments 1 - 4 used only noise insertion Experiment 1 focused solely on spectrograms. The
as data augmentation. visual results for two patients and two control group
Volume 1 Issue 3 (2024) 119 doi: 10.36922/aih.2992