
Page 126 - AIH-1-3
P. 126
Artificial Intelligence in Health Interpretability of deep models for COVID-19
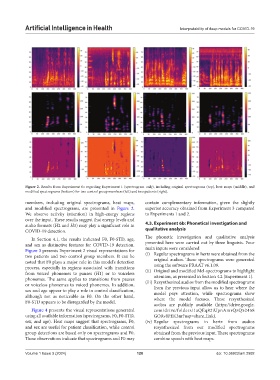
Figure 2. Results from Experiment 6a regarding Experiment 1 (spectrogram only), including original spectrograms (top), heat maps (middle), and
modified spectrograms (bottom) for two control group members (left) and two patients (right).
members, including original spectrograms, heat maps, contain complementary information, given the slightly
and modified spectrograms, are presented in Figure 2. superior accuracy obtained from Experiment 3 compared
We observe activity (attention) in high-energy regions to Experiments 1 and 2.
over the input. These results suggest that energy levels and
audio formats (H2 and H3) may play a significant role in 4.3. Experiment 6b: Phonetical investigation and
COVID-19 detection. qualitative analysis
In Section 4.1, the results indicated F0, F0-STD, age, The phonetic investigation and qualitative analysis
and sex as distinctive features for COVID-19 detection. presented here were carried out by three linguists. Four
Figure 3 presents Experiment 2 visual representations for main inputs were considered:
two patients and two control group members. It can be (i) Regular spectrograms in hertz were obtained from the
noted that F0 plays a major role in this model’s detection original audios. These spectrograms were generated
process, especially in regions associated with transitions using the software PRAAT v6.1.09.
from voiced phonemes to pauses (H1) or to voiceless (ii) Original and modified Mel-spectrograms to highlight
phonemes. The same applies to transitions from pauses attention, as presented in Section 4.2 (Experiment 1).
or voiceless phonemes to voiced phonemes. In addition, (iii) Resynthesized audios from the modified spectrograms
from the previous input allow us to hear where the
sex and age appear to play a role in control classification, model pays attention, while spectrograms show
although not as noticeable as F0. On the other hand, where the model focuses. These resynthesized
F0-STD appears to be disregarded by the model.
audios are publicly available (https://drive.google.
Figure 4 presents the visual representations generated com/drive/folders/1aQEq82iUpnAmrQzQ52458
using all available information (spectrograms, F0, F0-STD, GORv8PEK3nr?usp=share_link).
sex, and age). Heat maps suggest that spectrograms, F0, (iv) Regular spectrograms in hertz from audios
and sex are useful for patient classification, while control resynthesized from our modified spectrograms
group detections are based only on spectrograms and F0. obtained from the previous input. These spectrograms
These observations indicate that spectrograms and F0 may combine speech with heat maps.
Volume 1 Issue 3 (2024) 120 doi: 10.36922/aih.2992