
Page 124 - AIH-1-3
P. 124
Artificial Intelligence in Health Interpretability of deep models for COVID-19
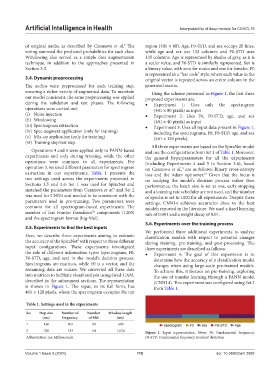
of original audio, as described by Casanova et al. The region (401 × 80). Age, F0-STD, and sex occupy 20 lines,
9
voting summed the predicted probabilities for each class. while age and sex use 133 columns and F0-STD uses
Windowing also served as a simple data augmentation 135 columns. Age is represented by shades of gray, as it is
technique, in addition to the approaches presented in a scalar value, and F0-STD is similarly represented. Sex is
Section 3.2. a binary value, with zero for males and one for females. F0
is represented in a “bar code” style, where each value in the
3.4. Dynamic preprocessing original vector is repeated across an entire column in the
The audios were preprocessed for each training step, generated matrix.
ensuring a richer variety of augmented data. To maintain Using the scheme presented in Figure 1, the first three
our model consistent, the same preprocessing was applied proposed experiments are:
during the validation and test phases. The following • Experiment 1: Uses only the spectrogram
operations were carried out: (401 × 80 pixels) as input
(i) Noise injection • Experiment 2: Uses F0, F0-STD, age, and sex
(ii) Windowing (401 × 40 pixels) as input
(iii) Spectrogram extraction • Experiment 3: Uses all input data present in Figure 1,
(iv) Spec-augment application (only for training) including the spectrograms, F0, F0-STD, age, and sex
(v) Mix-up application (only for training) (401 × 120 pixels).
(vi) Training step/test step.
All three experiments are based on the SpiraNet model
Operations 4 and 5 were applied only to PANN-based and use the configurations from Set 1 of Table 1. Moreover,
experiments and only during training, while the other the general hyperparameters for all the experiments
operations were common to all experiments. For (including Experiments 4 and 5 in Section 3.6), based
operation 3, we used different parameters for spectrogram on Casanova et al., are as follows: Binary cross-entropy
9
extraction in our experiments. Table 1 presents the loss and the Adam optimizer. Given that the focus is
31
two settings used across the experiments presented in on studying the model’s decision process rather than
Sections 3.5 and 3.6: Set 1 was used for SpiraNet and performance, the batch size is set at one, early stopping
matched the parameters from Casanova et al. and Set 2 and a learning rate scheduler are not used, and the number
9
was used for CNN4 and needed to be consistent with the of epochs is set to 1000 for all experiments. Despite these
parameters used in pre-training. Two parameters were settings, CNN14 achieves accuracies close to the best
common for all spectrogram-based experiments: The models reported in the literature. We used a fixed learning
number of fast Fourier fransform components (1200) rate of 0.001 and a weight decay of 0.01.
30
and the spectrogram format (log-Mel).
3.6. Experiments over the training process
3.5. Experiments to find the best inputs
We performed three additional experiments to analyze
Here, we describe three experiments aiming to estimate classification models with respect to potential changes
the accuracy of the SpiraNet with respect to three different during training, pre-training, and post-processing. The
9
input configurations. These experiments investigated three experiments are described as follows:
the role of different information types (spectrogram, F0, • Experiment 4: The goal of this experiment is to
F0-STD, age, and sex) in the model’s decision process. determine how the accuracy of a classification model
Spectrograms are matrices, while F0 is a vector, and the changes when using large-scale pre-trained models.
remaining data are scalars. We converted all these data To achieve this, it focuses on pre-training, exploring
into matrices to facilitate visual analysis using Grad-CAM, the use of transfer learning through a PANN model
described in the subsequent sections. The representation (CNN14). This experiment was configured using Set 2
is shown in Figure 1. The input, in its full form, has from Table 1.
401 × 120 pixels, where the spectrogram occupies the top
Table 1. Settings used in the experiments
Set Hop size Number of Number Window length
(ms) frequency of Mel (ms)
1 160 601 80 400
2 320 513 64 1,024 Figure 1. Input representation. Notes: F0: Fundamental frequency;
Abbreviation: ms: Milliseconds. F0-STD: Fundamental frequency standard deviation
Volume 1 Issue 3 (2024) 118 doi: 10.36922/aih.2992