
Page 104 - AIH-2-1
P. 104
Artificial Intelligence in Health EBNA1 inhibitors against EBV in NPC
A B C
D E F
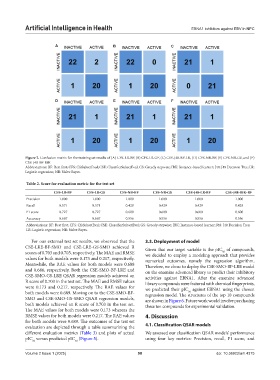
Figure 2. Confusion matrix for the training set results of (A) CFS-LR-BF, (B) CFS-LR-GF, (C) CSE-J48-BF-LR, (D) CFS-NB-BF, (E) CFS-NB-GS, and (F)
CSE-J48-BF-IBK
Abbreviations: BF: Best first; CFS: CfsSubsetEval; CSE: ClassifierSubsetEval; GS: Greedy stepwise; IBK: Instance-based learner; J48: J48 Decision Tree; LR:
Logistic regression; NB: Naïve Bayes.
Table 2. Score for evaluation metric for the test set
CFS‑LR‑BF CFS‑LR‑GS CFS‑NB‑BF CFS‑NB‑GS CSE‑J48‑LR‑BF CSE‑J48‑IBK‑BF
Precision 1.000 1.000 1.000 1.000 1.000 1.000
Recall 0.571 0.571 0.429 0.429 0.429 0.429
F1 score 0.727 0.727 0.600 0.600 0.600 0.600
Accuracy 0.667 0.667 0.556 0.556 0.556 0.556
Abbreviations: BF: Best first; CFS: CfsSubsetEval; CSE: ClassifierSubsetEval; GS: Greedy stepwise; IBK: Instance-based learner; J48: J48 Decision Tree;
LR: Logistic regression; NB: Naïve Bayes.
For our external test set results, we observed that the 3.3. Deployment of model
CSE-LRE-BF-SMO and CSE-LRE-GS-SMO achieved R Given that our target variable is the pIC of compounds,
scores of 0.703 and 0.705, respectively. The MAE and RMSE we decided to employ a modeling approach that provides
50
values for both models were 0.173 and 0.217, respectively. numerical outcomes, namely the regression algorithm.
Meanwhile, the RAE values for both models were 0.688 Therefore, we chose to deploy the CSE-SMO-BF-LRE model
and 0.686, respectively. Both the CSE-SMO-BF-LRE and on the enamine advanced library to predict their inhibitory
CSE-SMO-GS-LRE QSAR regression models achieved an activities against EBNA1. After the enamine advanced
R score of 0.703 in the test set. The MAE and RMSE values library compounds were featured with chemical fingerprints,
were 0.173 and 0.217, respectively. The RAE values for we predicted their pIC against EBNA1 using the chosen
both models were 0.689. Moving on to the CSE-SMO-BF- regression model. The structures of the top 10 compounds
50
SMO and CSE-SMO-GS-SMO QSAR regression models, are shown in Figure 6. Future work would involve purchasing
both models achieved an R score of 0.703 in the test set. these ten compounds for experimental validation.
The MAE values for both models were 0.173 whereas the
RMSE values for both models were 0.217. The RAE values 4. Discussion
for both models were 0.689. The outcomes of the test set
evaluation are depicted through a table summarizing the 4.1. Classification QSAR models
different evaluation metrics (Table 3) and plots of actual We assessed our classification QSAR models’ performance
pIC versus predicted pIC (Figure 5). using four key metrics: Precision, recall, F1 score, and
50
50
Volume 2 Issue 1 (2025) 98 doi: 10.36922/aih.4375