
Page 102 - AIH-2-1
P. 102
Artificial Intelligence in Health EBNA1 inhibitors against EBV in NPC
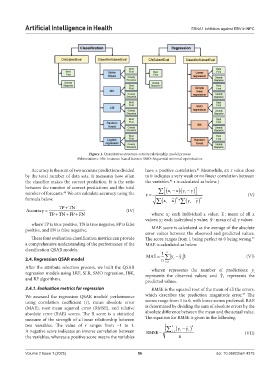
Figure 1. Quantitative structure-activity relationship model process
Abbreviations: IBK: Instance-based learner; SMO: Sequential minimal optimization.
Accuracy is the sum of two accurate predictions divided have a positive correlation. Meanwhile, an r value close
41
by the total number of data sets. It measures how often to 0 indicates a very weak or no linear correlation between
41
the classifier makes the correct prediction. It is the ratio the variables. r is calculated as below.]
between the number of correct predictions and the total x y
x y
number of forecasts. We can calculate accuracy using the r i i (V)
40
formula below. x y 2
x *
2
i
y
i
TP TN
Accuracy (IV)
TP TN FP FN where: x : each individual x value; x : mean of all x
i
values; y : each individual y value; y : mean of all y values
where TP is true positive, TN is true negative, FP is false i
positive, and FN is false negative. MAE score is calculated as the average of the absolute
error values between the observed and predicted values.
These four evaluation classification metrics can provide The score ranges from 1 being perfect to 0 being wrong.
42
a comprehensive understanding of the performance of the MAE is calculated as below.
classification QSAR models. n
MAE 1 y ˘ � (VI)
y
2.4. Regression QSAR model n i1 i i
After the attribute selection process, we built the QSAR wheren represents the number of predictions; y
regression models using LRE, SLR, SMO regression, IBK, represents the observed values; and ˆ y represents the i
and RF algorithms. predicted values. i
2.4.1. Evaluation metrics for regression RMSE is the squared root of the mean of all the errors,
43
We assessed the regression QSAR models’ performance which describes the prediction magnitude error. The
using correlation coefficient (r), mean absolute error scores range from 1 to 0, with lower scores preferred. RAE
(MAE), root mean squared error (RMSE), and relative is determined by dividing the sum of absolute errors by the
absolute error (RAE) scores. The R score is a statistical absolute difference between the mean and the actual value.
measure of the strength of a linear relationship between The equation for RMSE is given in the following.
two variables. The value of r ranges from −1 to 1. n y ˆ ) 2
A negative score indicates an inverse correlation between RMSE = ∑ i1= (y − i (VII)
i
the variables, whereas a positive score means the variables n
Volume 2 Issue 1 (2025) 96 doi: 10.36922/aih.4375