
Page 107 - AIH-2-1
P. 107
Artificial Intelligence in Health EBNA1 inhibitors against EBV in NPC
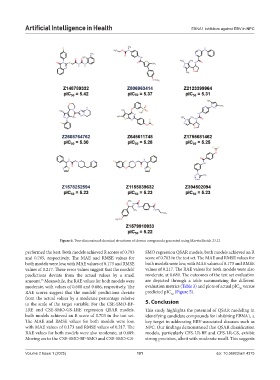
Figure 6. Two-dimensional chemical structures of chosen compounds generated using MarvinSketch 23.12
performed the best. Both models achieved R scores of 0.703 SMO regression QSAR models, both models achieved an R
and 0.705, respectively. The MAE and RMSE values for score of 0.703 in the test set. The MAE and RMSE values for
both models were low, with MAE values of 0.173 and RMSE both models were low, with MAE values of 0.173 and RMSE
values of 0.217. These error values suggest that the models’ values of 0.217. The RAE values for both models were also
predictions deviate from the actual values by a small moderate, at 0.689. The outcomes of the test set evaluation
amount. Meanwhile, the RAE values for both models were are depicted through a table summarizing the different
45
moderate, with values of 0.688 and 0.686, respectively. The evaluation metrics (Table 3) and plots of actual pIC versus
50
RAE scores suggest that the models’ predictions deviate predicted pIC (Figure 5).
50
from the actual values by a moderate percentage relative
to the scale of the target variable. For the CSE-SMO-BF- 5. Conclusion
LRE and CSE-SMO-GS-LRE regression QSAR models, This study highlights the potential of QSAR modeling in
both models achieved an R score of 0.703 in the test set. identifying candidate compounds for inhibiting EBNA1, a
The MAE and RMSE values for both models were low, key target in addressing EBV-associated diseases such as
with MAE values of 0.173 and RMSE values of 0.217. The NPC. Our findings demonstrated that QSAR classification
RAE values for both models were also moderate, at 0.689. models, particularly CFS-LR-BF and CFS-LR-GS, exhibit
Moving on to the CSE-SMO-BF-SMO and CSE-SMO-GS- strong precision, albeit with moderate recall. This suggests
Volume 2 Issue 1 (2025) 101 doi: 10.36922/aih.4375