
Page 106 - AIH-2-1
P. 106
Artificial Intelligence in Health EBNA1 inhibitors against EBV in NPC
A B C
D E F
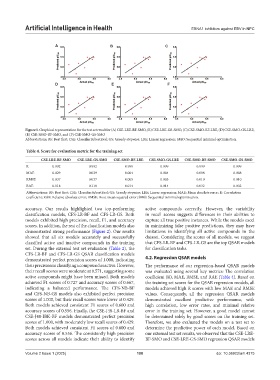
Figure 5. Graphical representation for the test set result for (A) CSE-LRE-BF-SMO, (B) CSE-LRE-GS-SMO, (C) CSE-SMO-BF-LRE, (D) CSE-SMO-GS-LRE,
(E) CSE-SMO-BF-SMO, and (F) CSE-SMO-GS-SMO
Abbreviations: BF: Best first; CSE: ClassifierSubsetEval; GS: Greedy stepwise; LRE: Linear regression; SMO: Sequential minimal optimization.
Table 4. Score for evaluation metric for the training set
CSE‑LRE‑BF‑SMO CSE‑LRE‑GS‑SMO CSE‑SMO‑BF‑LRE CSE‑SMO‑GS‑LRE CSE‑SMO‑BF‑SMO CSE‑SMO‑GS‑SMO
R 0.992 0.992 0.999 0.999 0.999 0.999
MAE 0.029 0.029 0.004 0.004 0.008 0.008
RMSE 0.037 0.037 0.005 0.005 0.010 0.010
RAE 0.118 0.118 0.014 0.014 0.032 0.032
Abbreviations: BF: Best first; CSE: ClassifierSubsetEval; GS: Greedy stepwise; LRE: Linear regression; MAE: Mean absolute error; R: Correlation
coefficient; RAE: Relative absolute error; RMSE: Root mean squared error; SMO: Sequential minimal optimization.
accuracy. Our results highlighted two top-performing active compounds correctly. However, the variability
classification models, CFS-LR-BF and CFS-LR-GS. Both in recall scores suggests differences in their abilities to
models exhibited high precision, recall, F1, and accuracy capture all true positive instances. While the models excel
scores. In addition, the rest of the classification models also in minimizing false positive predictions, they may have
demonstrated strong performance (Figure 2). Our results limitations in identifying all active compounds in the
showed that all six models accurately and successfully dataset. Considering the scores of all models, we suggest
classified active and inactive compounds in the training that CFS-LR-BF and CFS-LR-GS are the top QSAR models
set. During the external test set evaluation (Table 2), the for classification tasks.
CFS-LR-BF and CFS-LR-GS QSAR classification models
demonstrated perfect precision scores of 1.000, indicating 4.2. Regression QSAR models
their precision in classifying a compound as active. However, The performance of our regression-based QSAR models
their recall scores were moderate at 0.571, suggesting some was evaluated using several key metrics: The correlation
active compounds might have been missed. Both models coefficient (R), MAE, RMSE, and RAE (Table 4). Based on
achieved F1 scores of 0.727 and accuracy scores of 0.667, the training set scores for the QSAR regression models, all
indicating a balanced performance. The CFS-NB-BF models achieved high R scores with low MAE and RMSE
and CFS-NB-GS models also exhibited perfect precision values. Consequently, all the regression QSAR models
scores of 1.000, but their recall scores were lower at 0.429. demonstrated excellent predictive performance, with
Both models achieved consistent F1 scores of 0.600 and high correlation, low error rates, and minimal relative
accuracy scores of 0.556. Finally, the CSE-J48-LR-BF and error in the training set. However, a good model cannot
CSE-J48-IBK-BF models demonstrated perfect precision be determined solely by good scores on the training set.
scores of 1.000, with moderately low recall scores of 0.429. Therefore, we also evaluated the models on a test set to
Both models achieved consistent F1 scores of 0.600 and determine the predictive power of each model. Based on
accuracy scores of 0.556. The consistently high precision our external test set results, we observed that the CSE-LRE-
scores across all models indicate their ability to identify BF-SMO and CSE-LRE-GS-SMO regression QSAR models
Volume 2 Issue 1 (2025) 100 doi: 10.36922/aih.4375