
Page 114 - AIH-2-1
P. 114
Artificial Intelligence in Health ML approach for client and program effects in OUD retention
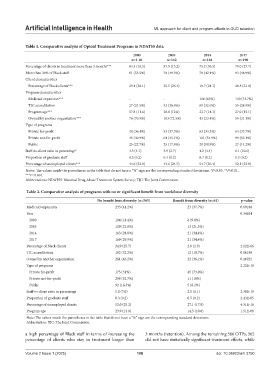
Table 1. Comparative analysis of Opioid Treatment Programs in NDATSS data
2000 2005 2014 2017
n=1 10 n=142 n=184 n=190
Percentage of clients in treatment more than 3 months*** 84.3 (16.5) 87.9 (13.2) 75.2 (30.5) 79.0 (27.7)
More than 20% of Black staff 61 (55.5%) 70 (49.3%) 78 (42.4%) 93 (48.9%)
Client characteristics
Percentage of Black clients*** 29.4 (28.1) 25.5 (26.4) 18.7 (24.1) 20.8 (23.0)
Program characteristics
Medicaid expansion*** - - 116 (63%) 140 (73.7%)
TJC accreditation 27 (24.5%) 52 (36.6%) 60 (32.6%) 55 (28.9%)
Program age*** 17.8 (11.6) 20.8 (12.0) 23.7 (14.1) 27.0 (15.1)
Owned by another organization*** 78 (70.9%) 103 (72.5%) 43 (23.4%) 59 (31.1%)
Type of programs
Private for-profit 40 (36.4%) 53 (37.3%) 63 (34.2%) 64 (33.7%)
Private not-for-profit 45 (40.9%) 64 (45.1%) 101 (54.9%) 99 (52.1%)
Public 25 (22.7%) 25 (17.6%) 20 (10.9%) 27 (14.2%)
Staff-to-client ratio in percentage* 4.3 (4.1) 3.9 (2.7) 4.2 (4.4) 6.1 (10.6)
Proportion of graduate staff 0.3 (0.2) 0.4 (0.2) 0.3 (0.2) 0.3 (0.2)
Percentage of unemployed clients*** 44.6 (23.0) 43.6 (24.7) 54.7 (26.4) 52.1 (25.8)
Notes: The values inside the parentheses in the table that do not have a “%” sign are the corresponding standard deviations. *P<0.05, **P<0.01,
***P<0.001.
Abbreviations: NDATSS: National Drug Abuse Treatment System Survey; TJC: The Joint Commission.
Table 2. Comparative analysis of programs with no or significant benefit from workforce diversity
No benefit from diversity (n=565) Benefit from diversity (n=61) p‑value
Medicaid expansion 233 (41.2%) 23 (37.7%) 0.69188
Year 0.34624
2000 104 (18.4%) 6 (9.8%)
2005 129 (22.8%) 13 (21.3%)
2014 163 (28.8%) 21 (34.4%)
2017 169 (29.9%) 21 (34.4%)
Percentage of Black clients 24.9 (25.7) 2.6 (2.9) 2.12E-66
TJC accreditation 182 (32.2%) 12 (19.7%) 0.06199
Owned by another organization 261 (46.2%) 22 (36.1%) 0.16922
Type of programs 2.22E-10
Private for-profit 175 (31%) 45 (73.8%)
Private not-for-profit 298 (52.7%) 11 (18%)
Public 92 (16.3%) 5 (8.2%)
Staff-to-client ratio in percentage 5.0 (7.0) 2.0 (1.1) 2.38E-19
Proportion of graduate staff 0.3 (0.2) 0.5 (0.2) 2.43E-05
Percentage of unemployed clients 52.0 (25.2) 27.1 (17.8) 4.31E-16
Program age 23.9 (13.9) 14.5 (10.8) 1.51E-08
Note: The values inside the parentheses in the table that do not have a “%” sign are the corresponding standard deviations.
Abbreviation: TJC: The Joint Commission.
a high percentage of Black staff in terms of increasing the 3 months (retention). Among the remaining 566 OTPs, 562
percentage of clients who stay in treatment longer than did not have statistically significant treatment effects, while
Volume 2 Issue 1 (2025) 108 doi: 10.36922/aih.3750