
Page 42 - AIH-2-1
P. 42
Artificial Intelligence in Health Deep learning on chest X-ray and CT for COVID-19
A B
C D
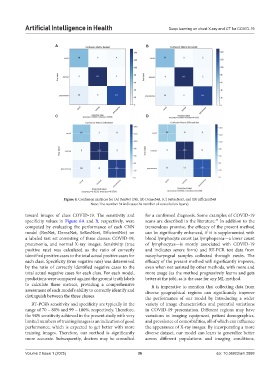
Figure 4. Confusion matrices for (A) ResNet (34), (B) DenseNet, (C) SeResNext, and (D) EfficientNet
Note: The number 34 indicates the number of convolution layers).
toward images of class COVID-19. The sensitivity and for a confirmed diagnosis. Some examples of COVID-19
specificity values in Figure 6A and B, respectively, were scans are described in the literature. In addition to the
47
computed by evaluating the performance of each CNN tremendous promise, the efficacy of the present method
model (ResNet, DenseNet, SeResNext, EfficientNet) on can be significantly enhanced, if it is supplemented with
a labeled test set consisting of three classes: COVID-19, blood lymphocyte count (as lymphopenia—a lower count
pneumonia, and normal X-ray images. Sensitivity (true of lymphocytes—is mostly associated with COVID-19
positive rate) was calculated as the ratio of correctly and indicates severe form) and RT-PCR test data from
identified positive cases to the total actual positive cases for nasopharyngeal samples collected through swabs. The
each class. Specificity (true negative rate) was determined efficacy of the present method will significantly improve,
by the ratio of correctly identified negative cases to the even when not assisted by other methods, with more and
total actual negative cases for each class. For each model, more usage (as the method progressively learns and gets
predictions were compared against the ground truth labels better at the job), as is the case for any ML method.
to calculate these metrics, providing a comprehensive It is imperative to mention that collecting data from
assessment of each model’s ability to correctly identify and diverse geographical regions can significantly improve
distinguish between the three classes. the performance of our model by introducing a wider
RT-PCR’s sensitivity and specificity are typically in the variety of image characteristics and potential variations
range of 70 – 80% and 99 – 100%, respectively. Therefore, in COVID-19 presentation. Different regions may have
the 94% sensitivity achieved in the present study with very variations in imaging equipment, patient demographics,
limited numbers of training images is an indication of good and prevalence of comorbidities, all of which can influence
performance, which is expected to get better with more the appearance of X-ray images. By incorporating a more
training images. Therefore, our method is significantly diverse dataset, our model can learn to generalize better
more accurate. Subsequently, doctors may be consulted across different populations and imaging conditions,
Volume 2 Issue 1 (2025) 36 doi: 10.36922/aih.2888