
Page 92 - AIH-2-1
P. 92
Artificial Intelligence in Health Benchmarking ML imputation in mental health surveys
rates. Around 39% of male participants have high missing identified as “Multiple Races” have low missing rates. The
rates, which is slightly larger than the 37% of female rates of missingness for self-reported African American,
participants, while 33.5% of male participants have low Asian, and Native American individuals are concentrated
missing rates, and only around 28% of female participants toward the extreme values, with more than 30% exhibiting
have low missing rates. high missing rates, while <25% of the participants who
were self-identified as White or “Multiple Races” reported
For individuals between ages 2 and 18, around 22% of high missing rates. Those who self-reported themselves as
these participants have medium missing rates. The missing an “Other” race exhibit large amounts of missingness since
rates of these individuals are more concentrated toward around 66% have missing rates larger than 80%.
extreme values since around 39% have either low or high
missing rates or 22% exhibit medium missing rates. For 3.2. Sample characteristics of complete dataset and
individuals below 2 years of age, around 40% have medium simulation of three missingness patterns
missing rates. Around 62% of individuals above 18 years of To assess the imputation performance of the four
age have medium missing rates, whereas nearly 0% exhibit popular missing data imputation methods (MICE, KNN,
low missing rates. MissForest, and MIDAS), a preprocessed complete dataset
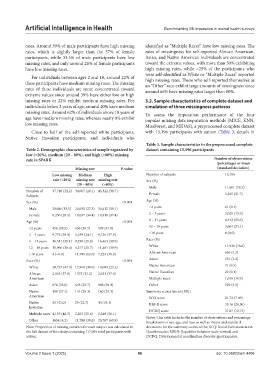
Close to half of the self-reported white participants, with 15,196 participants with autism (Table 3, details in
Native Hawaiian participants, and individuals who
Table 3. Sample characteristics in the preprocessed complete
Table 2. Demographic characteristics of sample organized by dataset containing 15,196 participants
low (<20%), medium (20 – 80%), and high (>80%) missing
rate in SPARK Number of observations
(percentage) or mean
Missing rate P‑value (standard deviation)
Low missing Medium High Number of subjects 15,196
rate (<20%) missing rate missing rate Sex (%)
(20 – 80%) (>80%)
Number of 37,710 (32.2) 34,067 (29.1) 45,322 (38.7) Male 11,901 (78.3)
Subjects Female 3,295 (21.7)
Sex (%) <0.001 Age (%)
Male 29460 (33.5) 24,030 (27.3) 34,412 (39.1) <2 years 61 (0.4)
Female 8,250 (28.3) 10,037 (34.4) 10,910 (37.4) 2 – 5 years 3,029 (19.9)
Age (%) <0.001 6 – 11 years 8,442 (55.6)
<2 years 456 (28.5) 636 (39.7) 509 (31.8) 12 – 18 years 3,664 (24.1)
2 – 5 years 9,773 (38.0) 6,189 (24.1) 9,726 (37.9) >18 years 0 (0.0)
6 – 11 years 16,511 (39.1) 9,230 (21.9) 16,463 (39.0) Race (%)
12 – 18 years 10,966 (38.4) 6,217 (21.7) 11,401 (39.9) White 11,938 (78.6)
>18 years 4 (~0.0) 11,795 (62.0) 7,223 (38.0) African American 656 (4.3)
Race (%) <0.001 Asian 331 (2.2)
White 28,727 (47.3) 17,968 (30.0) 14,093 (23.2) Native American 71 (0.5)
African 2,063 (37.8) 1373 (25.2) 2,021 (37.0) Native Hawaiian 22 (0.1)
American Multiple races 1,649 (10.9)
Asian 876 (35.0) 645 (25.7) 988 (39.4) Other 529 (3.5)
Native 180 (37.4) 141 (29.3) 160 (33.3) Summary scores (mean [SD])
American SCQ score 21.72 (7.09)
Native 55 (43.0) 29 (22.7) 44 (34.4) RBS-R score 35.16 (20.50)
hawaiian
DCDQ score 37.87 (12.73)
Multiple races 4,155 (48.3) 2,203 (25.6) 2,249 (26.1)
Notes: This table includes the number of observations and percentage
Other 1654 (4.2) 11,708 (30.0) 25,767 (65.9) breakdowns of sex, age, and race as well as means and standard
Note: Proportion of missing variables for each subject was calculated in deviations for the summary scores of the; SCQ: Social Communication
the full dataset of this study containing 117,099 total participants with Questionnaire; RBS-R: Repetitive behavior scale-revised; and
autism. DCDQ: Developmental coordination disorder questionnaire.
Volume 2 Issue 1 (2025) 86 doi: 10.36922/aih.4406