
Page 93 - AIH-2-1
P. 93
Artificial Intelligence in Health Benchmarking ML imputation in mental health surveys
Methods) was first obtained. Around 78% of participants dataset were used (Table 1) to reflect the missingness
with complete data are male and 22% are female. The male- distribution present in the real data.
to-female ratio is 3.5:1, which aligns with the sex ratio
among subjects with autism in the general population. 3.3. Performance of imputation on overall dataset
About half of the individuals with complete data are The four imputation methods were applied to the
between 6 and 11 years of age. Only 0.4% of subjects incomplete datasets in each of the three simulation
are under 2 years of age while none are above 18. About scenarios (Figure 3). The imputed values were compared
79% of participants were self-identified as white. The with the actual values in the complete dataset, and the
category with the second largest number of participants is RMSE values were calculated. RMSE can be interpreted
“Multiple Races” (10.9%), followed by African American as the average deviation of the predicted scores from the
(4.3%), “Other” (3.5%), and Asian (2.2%). The number of true scores in units of standard deviation since all variables
participants who are Native American or Native Hawaiian were standardized. Lower RMSE values correspond to
are below 1%. In the preprocessed complete dataset, the higher accuracy in missing value imputation.
SCQ, RBS-R, and DCDQ scores have average values of
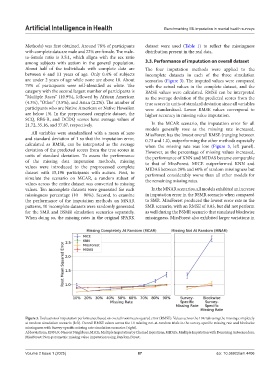
21.72, 35.16, and 37.87, respectively. In the MCAR scenario, the imputation error for all
models generally rose as the missing rate increased.
All variables were standardized with a mean of zero MissForest has the lowest overall RMSE (ranging between
and standard deviation of 1 so that the imputation error, 0.73 and 1.0), outperforming the other methods especially
calculated as RMSE, can be interpreted as the average when the missing rate was low (Figure 3, left panel).
deviation of the predicted scores from the true scores in However, as the percentage of missing values increased,
units of standard deviation. To assess the performance the performance of KNN and MIDAS became comparable
of the missing data imputation methods, missing to that of MissForest. MICE outperformed KNN and
values were introduced to the preprocessed complete MIDAS between 20% and 60% of random missingness but
dataset with 15,196 participants with autism. First, to performed considerably worse than all other models for
simulate the scenario on MCAR, a random subset of the remaining missing rates.
values across the entire dataset was converted to missing
values. Ten incomplete datasets were generated for each In the MNAR scenarios, all models exhibited an increase
missingness percentage (10 – 90%). Second, to examine in imputation error in the BSMR scenario when compared
the performance of the imputation methods on MNAR to SMR. MissForest produced the lowest error rate in the
patterns, 10 incomplete datasets were randomly generated SMR scenario, with an RMSE of 0.83, but did not perform
for the SMR and BSMR simulation scenarios separately. as well during the BSMR scenario that simulated blockwise
When doing so, the missing rates in the original SPARK missingness. MissForest also exhibited larger variations in
Figure 3. Evaluation of imputation performance based on overall root mean squared error (RMSE). Values across the 10 trials using the missing completely
at random simulation scenario (left). Overall RMSE values across the 10 missing not-at-random trials in the survey-specific missing rate and blockwise
missingness with Survey-specific missing rate simulation scenarios (right).
Abbreviations: KNN: K-Nearest Neighbors; MICE: Multiple Imputation by Chained Equations; MIDAS: Multiple Imputation with Denoising Autoencoders;
MissForest: Non-parametric missing value imputation using Random Forest.
Volume 2 Issue 1 (2025) 87 doi: 10.36922/aih.4406