
Page 27 - AIH-2-2
P. 27
Artificial Intelligence in Health Machine learning in arthroplasty
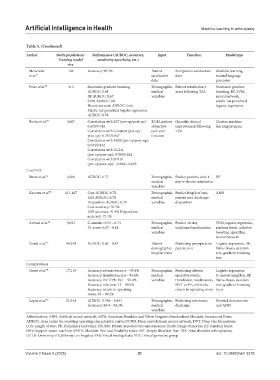
Table 3. (Continued)
Author Study population/ Performance (AUROC, accuracy, Input Function Model type
Training model sensitivity/specificity, etc.)
size
Menendez 186 Accuracy: 98.5% Patient Sort patient satisfaction Machine learning
et al. 71 satisfaction data natural language
data processor
Polce et al. 70 413 Stochastic gradient boosting Demographic, Patient satisfaction 2 Stochastic gradient
AUROC: 0.65 medical years following TSA boosting, RF, SVM,
RF AUROC: 0.67 variables neural network,
SVM AUROC: 0.8 elastic-net penalized
Neural network AUROC: 0.66 logistic regression
Elastic-net penalized logistic regression
AUROC: 0.74
Roche et al. 73 3,667 Correlation with SST (pre-op/post-op): ROM, patient Quantify clinical Custom machine
0.630/0.748 subjective improvement following learning program
Correlation with Constant (pre-op/ pain and TSA
post-op): 0.781/0.847 function
Correlation with ASES (pre-op/post-op):
0.694/0.832
Correlation with UCLA
(pre-op/post-op): 0.783/0.852
Correlation with SPADI
(pre-op/post-op): −0.694/−0.825
Cost/LOS
Biron et al. 74 4,500 AUROC: 0.77 Demographic, Predict patients with 1 RF
medical day or shorter admission
variables
Karnuta et al. 75 111,147 Cost AUROC: 0.72 Demographic, Predict length of stay, ANN
LOS AUROC: 0.78 medical patient cost, discharge
Disposition AUROC: 0.79 variables disposition
Cost accuracy: 76.5%
LOS accuracy: 91.8% Disposition
accuracy: 73.1%
Arvind et al. 76 9,043 C-statistic: 0.54 – 0.74 Demographic, Predict 30-day SVM, logistic regression,
F1-score: 0.07 – 0.18 medical unplanned readmission random forest, adaptive
variables boosting algorithm,
neural network
Gowd et al. 77 49,354 AUROC: 0.66 – 0.87 Patient Predicting perioperative Logistic regression, RF,
demographic, patient cost Naive-Bayes, decision
hospital traits tree, gradient boosting
tree
Complications
Gowd et al. 78 17,119 Accuracy adverse event: 6 – 95.4% Demographic, Predicting adverse Logistic regression,
Accuracy transfusion: 6.4 – 95.6% medical operative events, K-nearest neighbor, RF,
Accuracy DVT/PE: 38.1 – 99.4% variables transfusion, readmission, Naive-Bayes, decision
Accuracy infection: 13 – 99.6% DVT or PE, infection, tree, gradient boosting
Accuracy return to operating return to operating room trees
room: 36 – 99.2%
Lopez et al. 79 21,544 AUROC: 0.788 – 0.851 Demographic, Predicting non-home Boosted decision tree
Accuracy: 89.9 – 90.3% medical discharge and ANN
variables
Abbreviations: ANN: Artificial neural network; ASES: American Shoulder and Elbow Surgeons Standardized Shoulder Assessment Form;
AUROC: Area under the receiving operating characteristic curve; DCNN: Deep convolutional neural network; DVT: Deep vein thrombosis:
LOS: Length of stay; PE: Pulmonary embolism; PROMS: Patient-reported outcome measures; ROM: Range of motion; RF: Random forest;
SMV: Support vector machine; SPADI: Shoulder Pain and Disability Index; SST: Simple Shoulder Test; TSA: Total shoulder arthroplasties;
UCLA: University of California Los Angeles; VAS: Visual Analog Scale; VGG: Visual geometry group.
Volume 2 Issue 2 (2025) 21 doi: 10.36922/aih.3278