
Page 136 - AIH-2-3
P. 136
Artificial Intelligence in Health Early detection of CIN/cervicitis using ML
A B C
D
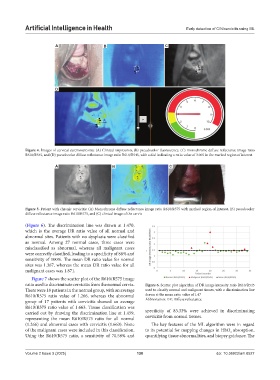
Figure 4. Images of cervical carcinosarcoma: (A) Clinical impression, (B) pseudocolor fluorescence, (C) monochrome diffuse reflectance image ratio
R610/R545, and (D) pseudocolor diffuse reflectance image ratio R610/R545, with a dial indicating a ratio value of 3.005 in the marked region of interest
A B C
Figure 5. Patient with chronic cervicitis: (A) Monochrome diffuse reflectance image ratio R610/R575 with marked region of interest, (B) pseudocolor
diffuse reflectance image ratio R610/R575, and (C) clinical image of the cervix
(Figure 6). The discrimination line was drawn at 1.470,
which is the average DR ratio value of all normal and
abnormal sites. Patients with no dysplasia were classified
as normal. Among 27 normal cases, three cases were
misclassified as abnormal, whereas all malignant cases
were correctly classified, leading to a specificity of 88% and
sensitivity of 100%. The mean DR ratio value for normal
sites was 1.367, whereas the mean DR ratio value for all
malignant cases was 1.871.
Figure 7 shows the scatter plot of the R610/R575 image
ratio used to discriminate cervicitis from the normal cervix. Figure 6. Scatter plot algorithm of DR image intensity ratio R610/R545
There were 18 patients in the normal group, with an average used to classify normal and malignant tissues, with a discrimination line
R610/R575 ratio value of 1.266, whereas the abnormal drawn at the mean ratio value of 1.47
group of 17 patients with cervicitis showed an average Abbreviation: DR: Diffuse reflectance.
R610/R575 ratio value of 1.663. Tissue classification was
carried out by drawing the discrimination line at 1.459, specificity of 83.33% were achieved in discriminating
representing the mean R610/R575 ratio for all normal cervicitis from normal tissues.
(1.266) and abnormal cases with cervicitis (1.663). None The key features of the ML algorithm were in regard
of the malignant cases were included in this classification. to its potential for mapping changes in HbO absorption,
2
Using the R610/R575 ratio, a sensitivity of 70.58% and quantifying tissue abnormalities, and biopsy guidance. The
Volume 2 Issue 3 (2025) 130 doi: 10.36922/aih.8527