
Page 137 - AIH-2-3
P. 137
Artificial Intelligence in Health Early detection of CIN/cervicitis using ML
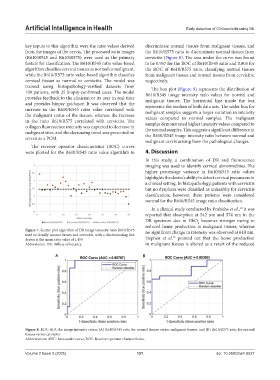
key inputs to this algorithm were the ratio values derived discriminate normal tissues from malignant tissues, and
from the images of the cervix. The processed ratio images the R610/R575 ratio to discriminate normal tissues from
(R610/R545 and R610/R575) were used as the primary cervicitis (Figure 8). The area under the curve was found
feature for classification. The R610/R545 ratio value-based to be 0.957 for the ROC of R610/R545 ratio and 0.803 for
algorithm classifies cervical tissues as normal or malignant, the ROC of R610/R575 ratio, classifying normal tissues
while the R610/R575 ratio value-based algorithm classifies from malignant tissues and normal tissues from cervicitis,
cervical tissues as normal or cervicitis. The model was respectively.
trained using histopathology-verified datasets from The box plot (Figure 9) represents the distribution of
109 patients, with 35 biopsy-confirmed cases. The model R610/R545 image intensity ratio values for normal and
provides feedback to the clinician or its user in real-time malignant tissues. The horizontal line inside the box
and provides biopsy guidance. It was observed that the represents the median of both data sets. The wider box for
increase in the R610/R545 ratio value correlated with malignant samples suggests a larger variation in intensity
the malignant status of the tissues, whereas the increase values compared to normal samples. The malignant
in the ratio R610/R575 correlated with cervicitis. The
collagen fluorescence intensity was expected to decrease in samples demonstrated higher intensity values compared to
the normal samples. This suggests a significant difference in
malignant sites, and the decreasing trend was presented on the R610/R545 image intensity ratio between normal and
screen as a PCM.
malignant cervix arising from the pathological changes.
The receiver operator characteristics (ROC) curves
were plotted for the R610/R545 ratio value algorithm to 4. Discussion
In this study, a combination of DR and fluorescence
imaging was used to identify cervical abnormalities. The
higher percentage variance in R610/R545 ratio values
highlights the device’s ability to detect cervical precancers in
a clinical setting. In histopathology, patients with cervicitis
but no dysplasia were classified as unhealthy for cervicitis
classification; however, these patients were considered
normal for the R610/R545 image ratio classification.
In a clinical study conducted by Prabitha et al., it was
10
reported that absorption at 542 nm and 574 nm in the
DR spectrum due to HbO becomes stronger owing to
2
reduced heme production in malignant tissues, whereas
Figure 7. Scatter plot algorithm of DR image intensity ratio R610/R575 no significant change in intensity was observed at 610 nm.
used to classify normal tissues and cervicitis, with a discriminating line 15
drawn at the mean ratio value of 1.459 Stephen et al. pointed out that the heme production
Abbreviation: DR: Diffuse reflectance. in malignant tissues is altered as a result of the reduced
A B
Figure 8. ROC-AUC for image intensity ratios: (A) R610/R545 ratio for normal tissues versus malignant tissues, and (B) R610/R575 ratio for normal
tissues versus cervicitis
Abbreviations: AUC: Area under curve; ROC: Receiver operator characteristics.
Volume 2 Issue 3 (2025) 131 doi: 10.36922/aih.8527