
Page 113 - AIH-2-4
P. 113
Artificial Intelligence in Health Autonomic nervous system patterns in men
iteratively recalculated until convergence (Equation II) by 4. Results
minimizing the sum of squared errors (Equation III).
Table 1 presents the anthropometric, physical, and HRV
The following equations were applied in the K-means data of the participants. Normality tests indicate that age,
clustering process: body mass, height, and MRR follow a Gaussian distribution
(p ≥ 0.05), and the low standard deviations support the
i
dp q, n q 2 (I) homogeneity of the sample. However, SDNN, RMSSD,
p
i
i1
pNN50, LF, and HF do not follow a normal distribution (p <
1 0.05). These findings highlight the importance of HRV data
m x (II) normalization in the context of machine learning, particularly
n k iC k i when applying techniques such as PCA and K-means.
Where: After dimensionality reduction using PCA, a non-
• x is the HRV values hierarchical K-means clustering algorithm was applied to
i
• n is the number of points in C k the first two PCs. The algorithm was initialized randomly
k
• m is the centroid of a cluster
• d is the Euclidean distance
• p is a data point Table 1. Anthropometric characteristics and heart rate
variability parameters of the participants
• q is a cluster centroid
• q is the i-th attribute of data point q Variables Mean±standard deviation p‑value
i
• p is the i-th attribute of data point p. Age (years) 22.0±2.8 0.200
i
J k ( x m ) 2 (III) Body mass (kg) 65.2±6.9 0.935
k 1 iC k i k Height (cm) 171.0±6.5 0.745
i
Where: MRR (ms) 935.0±132.2 0.571
• J is the within-cluster sum of squares (WCSS), which SDNN (ms) 62.8±30.9 0.008
k
is the objective function for K-means RMSSD (ms) 72.7±44.6 0.001
• k is the number of clusters pNN50 (%) 36.6±24.5 0.007
• m is the centroid of cluster k. LF (%) 49.0±21.8 0.015
k
To identify distinct subgroups within the dataset, the HF (%) 51.8±22.2 0.031
elbow method was used to determine the optimal number Abbreviations: HF: High-frequency; LF: Low-frequency; MRR: Mean
of clusters (k) by evaluating the WCSS, while silhouette R-R interval; pNN50: The proportion of adjacent normal-to-normal
analysis measures how well each data point fits within its intervals differing by more than 50 ms; RMSSD: The root mean square
of successive differences between adjacent intervals; SDNN: The
assigned cluster. Once the optimal k was established, the standard deviation of all normal-to-normal intervals.
K-means algorithm partitioned the data by iteratively
refining cluster centroids until membership stabilized. The
quality of this final partition was visually validated using
a silhouette plot, which graphically displays the cohesion
and separation of the resulting clusters. To complement
47
this analysis, agglomerative clustering was conducted
using Ward’s linkage method with a Euclidean distance
metric, and the output was visualized as a dendrogram.
After identifying three clusters, a one-way analysis
of variance was conducted to assess whether there are
significant differences in HRV parameters among the
groups. Additionally, post hoc Tukey’s tests were applied for
pairwise comparisons. The magnitude of these differences
was evaluated using Cohen’s d effect size, and statistical
significance was assessed using 95% confidence intervals
(CI) for the mean difference. All statistical analyses were
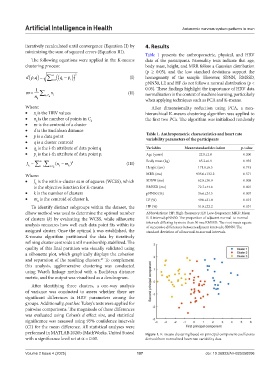
performed in MATLAB 2020b (MathWorks, United States) Figure 1. K-means clustering based on principal component coefficients
with a significance level set at α = 0.05. derived from normalized heart rate variability data
Volume 2 Issue 4 (2025) 107 doi: 10.36922/AIH025050006