
Page 114 - AIH-2-4
P. 114
Artificial Intelligence in Health Autonomic nervous system patterns in men
and run for 10 iterations, resulting in the partitioning of Cluster 1 demonstrates a significantly greater
the data into three distinct clusters, as shown in Figure 1. parasympathetic profile than cluster 2. This is supported
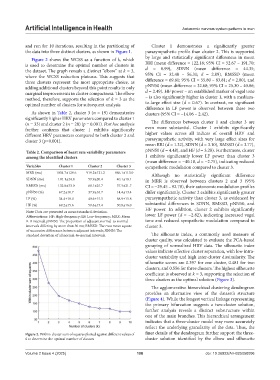
Figure 2 shows the WCSS as a function of k, which by large and statistically significant differences in mean
is used to determine the optimal number of clusters in RRI (mean difference = 122.18; 95% CI = 52.67 – 191.70;
the dataset. The graph reveals a distinct “elbow” at k = 3, d = 0.99), SDNN (mean difference = 44.35;
where the WCSS reduction plateaus. This suggests that 95% CI = 32.40 – 56.31; d = 2.09), RMSSD (mean
three clusters represent the most appropriate choice, as difference = 69.81; 95% CI = 55.80 – 83.81; d = 2.80), and
adding additional clusters beyond this point results in only pNN50 (mean difference = 32.68; 95% CI = 25.30 – 40.06;
marginal improvements in cluster compactness. The elbow d = 2.49). HF power – an established marker of vagal tone
method, therefore, supports the selection of k = 3 as the – is also significantly higher in cluster 1, with a medium-
optimal number of clusters for subsequent analysis. to-large effect size (d = 0.67). In contrast, no significant
difference in LF power is observed between these two
As shown in Table 2, cluster 3 (n = 19) demonstrates clusters (95% CI = −14.06 – 2.42).
significantly higher HRV parameters compared to cluster 1
(n = 33) and cluster 2 (n = 28) (p = 0.001). Post hoc analysis The differences between cluster 1 and cluster 3 are
further confirms that cluster 1 exhibits significantly even more substantial. Cluster 1 exhibits significantly
different HRV parameters compared to both cluster 2 and higher values across all indices of overall HRV and
cluster 3 (p=0.001). parasympathetic activity, with very large effect sizes for
mean RRI (d = 1.32), SDNN (d = 3.10), RMSSD (d = 3.77),
Table 2. Comparison of heart rate variability parameters pNN50 (d = 4.48), and HF (d = 3.28). Furthermore, cluster
among the identified clusters 1 exhibits significantly lower LF power than cluster 3
(mean difference = −40.18, d = −2.75), indicating reduced
Variables Cluster 1 Cluster 2 Cluster 3 sympathetic modulation compared to cluster 3.
MRR (ms) 1034.7±129.6 919.2±121.2 886.1±113.0 Although no statistically significant difference
SDNN (ms) 101.1±24.8 59.9±20.4 40.1±18.1 in MRR is observed between clusters 2 and 3 (95%
RMSSD (ms) 132.8±33.0 68.1±25.7 37.5±21.7 CI = −29.45 – 92.78), their autonomic modulation profiles
pNN50 (%) 67.2±10.7 37.9±16.7 14.4±13.4 differ significantly. Cluster 2 exhibits significantly greater
LF (%) 34.4±18.0 40.6±15.5 68.9±15.8 parasympathetic activity than cluster 3, as evidenced by
HF (%) 69.2±15.6 59.6±15.4 30.8±16.0 substantial differences in SDNN, RMSSD, pNN50, and
Note: Data are presented as mean±standard deviation. HF power. In addition, cluster 2 exhibits significantly
Abbreviations: HF: High-frequency; LF: Low-frequency; MRR: Mean lower LF power (d = −2.82), indicating increased vagal
R-R interval; pNN50: The proportion of adjacent normal-to-normal tone and reduced sympathetic modulation compared to
intervals differing by more than 50 ms; RMSSD: The root mean square cluster 3.
of successive differences between adjacent intervals; SDNN: The
standard deviation of all normal-to-normal intervals. The silhouette index, a commonly used measure of
cluster quality, was calculated to evaluate the PCA-based
grouping of normalized HRV data. The silhouette index
values indicate effective cluster separation, with low intra-
cluster variability and high inter-cluster dissimilarity. The
silhouette scores are 0.397 for one cluster, 0.481 for two
clusters, and 0.556 for three clusters. The highest silhouette
coefficient is observed at k = 3, supporting the selection of
three clusters as the optimal solution (Figure 3).
The agglomerative hierarchical clustering dendrogram
provides an alternative view of the dataset’s structure
(Figure 4). While the longest vertical linkage representing
the primary bifurcation suggests a two-cluster solution,
further analysis reveals a distinct substructure within
one of the main branches. This hierarchical arrangement
indicates that a three-cluster model may more accurately
reflect the underlying granularity of the data. Thus, the
Figure 2. Within-cluster sum of squares plotted against different values of finer details of the dendrogram further support the three-
k to determine the optimal number of clusters cluster solution identified by the elbow and silhouette
Volume 2 Issue 4 (2025) 108 doi: 10.36922/AIH025050006