
Page 100 - AJWEP-22-4
P. 100
Salako, et al.
as optimal based on a cross-validation score >0.7. assess the geographic coordinates of questionable
These random background points were used as pseudo- occurrence data obtained from GBIF.
absence data to characterize the modeling environment A total of six image scenes were downloaded from
in the study area. The combined data (presence and the USGS EarthExplorer, covering the spatial extent
27
background data/pseudo-absence records) were then of the study area along Landsat paths 189 – 191 and
used to calibrate the model. rows 053 – 054. From each scene, four spectral bands
were selected: the green band (Band 3), red band
2.3. Remote sensing data collection and processing (Band 4), near-infrared band (Band 5), and short-wave
Satellite images of Landsat 8 – 9 surface reflectance infrared 2 (Band 7). These images, collected between
at Collection 2, Level 1 (radiometrically corrected) July and September 2024, were 90% cloud-free and
for the year 2024 were acquired from the United coincided with the planting and growing season or
States Geological Survey EarthExplorer platform the peak of plant greenness in the study area. These
(https://earthexplorer.usgs.gov/). Landsat 8 and Landsat selected bands have been used in several studies to
9 were launched on February 11, 2013, and September extract data and information on vegetation health.
17
27, 2021, respectively, with both providing moderate- All image scenes and their respective spectral bands
resolution imagery across 11 spectral bands, ranging (a total of 24) were mosaicked for further analysis
from 15 to 100 m of global land surface. (Figure 2).
Landsat 8 and Landsat 9 are equipped with two
sensors: The Operational Land Imager and Thermal 2.4. Estimation of vegetation phenology parameters/
Infrared Sensor, both of which offer improved signal- indices
to-noise ratio radiometric performance, enhancing To estimate relevant vegetation phenology/indices,
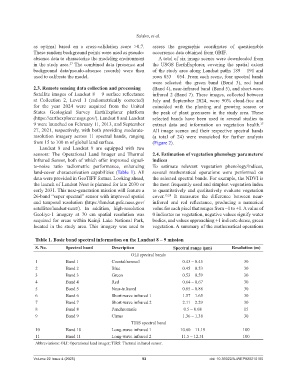
land-cover characterization capabilities (Table 1). All several mathematical operations were performed on
data were provided in GeoTIFF format. Looking ahead, the selected spectral bands. For example, the NDVI is
the launch of Landsat Next is planned for late 2030 or the most frequently used and simplest vegetation index
early 2031. This next-generation mission will feature a to quantitatively and qualitatively evaluate vegetation
26-band “super spectral” sensor with improved spatial cover. 15,28 It measures the difference between near-
and temporal resolution (https://landsat.gsfc.nasa.gov/ infrared and red reflectance, producing a numerical
satellites/landsat-next/). In addition, high-resolution value for each pixel that ranges from −1 to +1. A value of
GeoEye-1 imagery at 70 cm spatial resolution was 0 indicates no vegetation, negative values signify water
acquired for areas within Kainji Lake National Park, bodies, and values approaching +1 indicate dense, green
located in the study area. This imagery was used to vegetation. A summary of the mathematical operations
Table 1. Basic band spectral information on the Landsat 8 – 9 mission
S. No. Spectral band Description Spectral range (μm) Resolution (m)
OLI spectral bands
1 Band 1 Coastal/aerosol 0.43 – 0.45 30
2 Band 2 Blue 0.45 – 0.53 30
3 Band 3 Green 0.53 – 0.59 30
4 Band 4 Red 0.64 – 0.67 30
5 Band 5 Near-infrared 0.85 – 0.88 30
6 Band 6 Short-wave infrared 1 1.57 – 1.65 30
7 Band 7 Short-wave infrared 2 2.11 – 2.29 30
8 Band 8 Panchromatic 0.5 – 0.68 15
9 Band 9 Cirrus 1.36 – 1.38 30
TIRS spectral band
10 Band 10 Long-wave infrared 1 10.60 – 11.19 100
11 Band 11 Long-wave infrared 2 11.5 – 12.51 100
Abbreviations: OLI: Operational land imager; TIRS: Thermal infrared sensor.
Volume 22 Issue 4 (2025) 92 doi: 10.36922/AJWEP025210160