
Page 104 - AJWEP-22-4
P. 104
Salako, et al.
V. paradoxa but also supports healthy and viable tree
populations, as identified through could be found based
on the thresholded vegetation indices. To determine the
SZPI, the following steps were taken:
(i) The predicted SDM probability raster was
reclassified into two classes by setting a suitability
46
threshold at ≥60% probability: suitable (1) and not
suitable (0; less than the threshold). 19,22
(ii) Vegetation indices were reclassified based on
optimal point (greenness peak) thresholds, derived
from a response-curve mode. This is the peak point
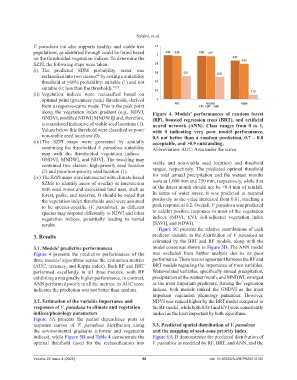
along the vegetation index gradient (e.g., NDVI, Figure 4. Models’ performances of random forest
GNDVI, modified NDWI [MNDWI]) and, therefore, (RF), boosted regression trees (BRT), and artificial
is considered indicative of viable seed locations (1). neural network (ANN). Class ranges from 0 to 1,
Values below this threshold were classified as poor/ with 0 indicating very poor model performance,
non-viable seed locations (0). 0.5 not better than a random prediction, 0.7 – 0.8
(iii) The SZPI maps were generated by spatially acceptable, and >0.9 outstanding.
combining the thresholded V. paradoxa suitability Abbreviation: AUC: Area under the curve.
map with the thresholded vegetation indices—
GNDVI, MNDWI, and NDVI. The resulting map
contained two classes: high-priority seed location viable and non-viable seed location) and threshold
(2) and poor/non-priority seed location (1). ranges, respectively. The predicted optimal threshold
(iv) The SZPI maps were intersected with climate-based for total annual precipitation and the wettest months
SZMs to identify areas of overlap or intersection were at 1,000 mm and 250 mm, respectively, while that
with seed zones and associated land uses, such as of the driest month should not be <0.4 mm of rainfall.
forest, parks, and reserves. It should be noted that In terms of water stress, it was predicted to respond
the vegetation index thresholds used were assumed positively as the value increased from 0.01, reaching a
to be species-specific (V. paradoxa), as different peak response at 0.2. Overall, V. paradoxa was predicted
species may respond differently to NDVI and other to exhibit positive responses to most of the vegetation
vegetation indices, potentially leading to varied indices (NDVI, EVI, soil-adjusted vegetation index
results. [SAVI], and NDWI).
Figure 5C presents the relative contributions of each
3. Results predictor variable to the distribution of V. paradoxa as
estimated by the BRT and RF models, along with the
3.1. Models’ predictive performances model consensus shown in Figure 5D. The ANN model
Figure 4 presents the predictive performances of the was excluded from further analysis due to its poor
three models’ algorithms across the evaluation metrics performance. There was an agreement between the RF and
(AUC, accuracy, and Kappa index). Both RF and BRT BRT models regarding the importance of most variables.
performed excellently in all three metrics, with RF Water-related variables, specifically annual precipitation,
exhibiting a marginally higher performance. In contrast, precipitation of the wettest month, and MNDWI, emerged
ANN performed poorly in all the metrics; its AUC score as the most important predictors. Among the vegetation
indicates the prediction was not better than random. indices, both models ranked the GNDVI as the most
important vegetation phenology parameter. However,
3.2. Estimation of the variable importance and NDVI was ranked higher by the BRT model compared to
responses of V. paradoxa to climate and vegetation the RF model, while both SAVI and EVI were consistently
indices/phenology parameters ranked as the least important by both algorithms.
Figure 5A presents the partial dependence plots or
response curves of V. paradoxa distribution along 3.3. Predicted spatial distribution of V. paradoxa
the environmental gradients (climate and vegetation and the mapping of seed-zone priority index
indices), while Figure 5B and Table 4 demonstrate the Figure 6A-D demonstrates the predicted distribution of
optimal threshold (used for the reclassification into V. paradoxa as modeled by RF, BRT, and ANN, and the
Volume 22 Issue 4 (2025) 96 doi: 10.36922/AJWEP025210160