
Page 105 - AJWEP-22-4
P. 105
Conservation of the vulnerable Vitellaria Paradoxa
A C
B
D
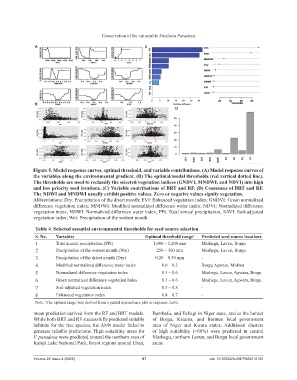
Figure 5. Model response curves, optimal threshold, and variable contributions. (A) Model response curves of
the variables along the environmental gradient. (B) The optimal/modal thresholds (red vertical dotted line).
The thresholds are used to reclassify the selected vegetation indices (GNDVI, MNDWI, and NDVI) into high
and low priority seed locations. (C) Variable contributions of BRT and RF. (D) Consensus of BRT and RF.
The NDWI and MNDWI usually exhibit positive values. Zero or negative values signify vegetation.
Abbreviations: Dry: Precipitation of the driest month; EVI: Enhanced vegetation index; GNDVI: Green normalized
difference vegetation index; MNDWI: Modified normalized difference water index; NDVI: Normalized difference
vegetation index; NDWI: Normalized difference water index; PPt: Total annual precipitation; SAVI: Soil-adjusted
vegetation index; Wet: Precipitation of the wettest month.
Table 4. Selected essential environmental thresholds for seed source selection
S. No. Variables Optimal threshold range a Predicted seed source locations
1 Total annual precipitation (PPt) 1,000 – 1,200 mm Mashegu, Lavun, Borgu
2 Precipitation of the wettest month (Wet) 250 – 300 mm Mashegu, Lavun, Borgu
3 Precipitation of the driest month (Dry) 0.20 – 0.30 mm -
4 Modified normalized difference water index 0.0 – 0.2 Borgu Agwara, Mokwa
5 Normalized difference vegetation index 0.3 – 0.6 Mashegu, Lavun, Agwara, Borgu
6 Green normalized difference vegetation index 0.3 – 0.6 Mashegu, Lavun, Agwara, Borgu
7 Soil-adjusted vegetation index 0.3 – 0.8 -
8 Enhanced vegetation index 0.4 – 0.7 -
Note: The optimal range was derived from a partial dependence plot or response curve.
a
mean prediction derived from the RF and BRT models. Bambafu, and Fellagi in Niger state, and at the border
While both BRT and RF successfully predicted suitable of Borgu, Kaiama, and Baruten local government
habitats for the tree species, the ANN model failed to area of Niger and Kwara states. Additional clusters
generate reliable predictions. High suitability areas for of high suitability (>60%) were predicted in central
V. paradoxa were predicted around the northern area of Mashegu, northern Lavun, and Borgu local government
Kainji Lake National Park, forest regions around Eban, areas.
Volume 22 Issue 4 (2025) 97 doi: 10.36922/AJWEP025210160