
Page 102 - AJWEP-22-4
P. 102
Salako, et al.
specific leaf area vegetation index was excluded, the annual precipitation (Bio 12), precipitation amount of
green NDVI (GNDVI), NDVI, and enhanced vegetation the wettest month (Bio 13), and precipitation amount
index (EVI) were retained to capture subtle yet important of the driest month (Bio 14). Bio 1 was subsequently
information peculiar to each vegetation index (Figure 3). excluded from the modeling, as it showed minimal
Climate data (Table 3) at a 1 km spatial resolution variation across the study area. In addition, both the
were obtained from the climatologies at high resolution satellite imagery and climate data in GeoTIFF format
for the Earth’s land surface areas (CHELSA) dataset. were resampled to 30 m spatial resolution.
33
CHELSA provides interpolated average climate data
for the period 1981 – 2010. Four climate data points 2.5. Species distribution model calibration and
considered ecologically and physiologically relevant assessment
to the growth and distribution of V. paradoxa were The SDMs were fitted using three machine learning
preselected: mean annual temperature (Bio 1), total algorithms (random forest [RF], boosted regression
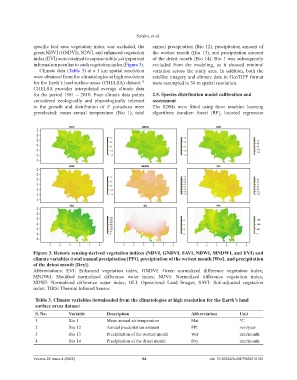
Figure 3. Remote sensing-derived vegetation indices (NDVI, GNDVI, SAVI, NDWI, MNDWI, and EVI) and
climate variables (total annual precipitation [PPt], precipitation of the wettest month [Wet], and precipitation
of the driest month [Dry])
Abbreviations: EVI: Enhanced vegetation index; GNDVI: Green normalized difference vegetation index;
MNDWI: Modified normalized difference water index; NDVI: Normalized difference vegetation index;
NDWI: Normalized difference water index; OLI: Operational Land Imager; SAVI: Soil-adjusted vegetation
index; TIRS: Thermal Infrared Sensor.
Table 3. Climate variables downloaded from the climatologies at high resolution for the Earth’s land
surface areas dataset
S. No. Variable Description Abbreviation Unit
1 Bio 1 Mean annual air temperature Mat °C
2 Bio 12 Annual precipitation amount PPt mm/year
3 Bio 13 Precipitation of the wettest month Wet mm/month
4 Bio 14 Precipitation of the driest month Dry mm/month
Volume 22 Issue 4 (2025) 94 doi: 10.36922/AJWEP025210160