
Page 106 - AJWEP-22-4
P. 106
Salako, et al.
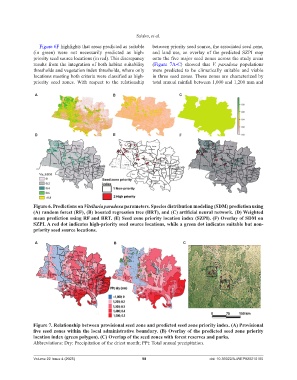
Figure 6F highlights that areas predicted as suitable between priority seed source, the associated seed zone,
(in green) were not necessarily predicted as high- and land use, an overlay of the predicted SZPI map
priority seed source locations (in red). This discrepancy onto the five major seed zones across the study areas
results from the integration of both habitat suitability (Figure 7A-C) showed that V. paradoxa populations
thresholds and vegetation index thresholds, where only were predicted to be climatically suitable and viable
locations meeting both criteria were classified as high- in three seed zones. These zones are characterized by
priority seed zones. With respect to the relationship total annual rainfall between 1,000 and 1,200 mm and
A B C
D E F
Figure 6. Predictions on Vitellaria paradoxa parameters. Species distribution modeling (SDM) prediction using
(A) random forest (RF), (B) boosted regression tree (BRT), and (C) artificial neural network. (D) Weighted
mean prediction using RF and BRT. (E) Seed zone priority location index (SZPI). (F) Overlay of SDM on
SZPI. A red dot indicates high-priority seed source locations, while a green dot indicates suitable but non-
priority seed source locations.
A B C
Figure 7. Relationship between provisional seed zone and predicted seed zone priority index. (A) Provisional
five seed zones within the local administrative boundary. (B) Overlay of the predicted seed zone priority
location index (green polygon). (C) Overlap of the seed zones with forest reserves and parks.
Abbreviations: Dry: Precipitation of the driest month; PPt: Total annual precipitation.
Volume 22 Issue 4 (2025) 98 doi: 10.36922/AJWEP025210160