
Page 151 - AJWEP-22-4
P. 151
HR and logistics in flood response
and professionals at 3.9%. Respondents possessed independence. Ensuring low multicollinearity is crucial
an average of 15 years of experience in humanitarian for interpreting the path coefficients (β) reliably, as
missions, reflecting substantial field expertise that high multicollinearity can inflate standard errors and
enhances the validity and depth of the collected data. 19 distort the significance of estimated effects. Therefore,
the low VIF values support the validity of the model’s
2.3. Data analysis structure and the integrity of its conclusions regarding
The analysis of quantitative data was conducted the influence of HRM and logistics coordination on
utilizing SmartPLS version 3.2.8, which is recognized humanitarian performance.
as a premier software for PLS-SEM. PLS-SEM was
21
chosen for its capability to estimate intricate models 3. Results
involving latent constructs and its appropriateness for
exploratory research that deals with non-normal data The assessment of the measurement model shown in
distributions. The process consisted of two phases: Table 1 illustrates the reliability and validity of the
11
the measurement model and the structural model. The constructs employed in examining the relationship
measurement model evaluated the reliability and validity among HRM, logistics coordination, and the
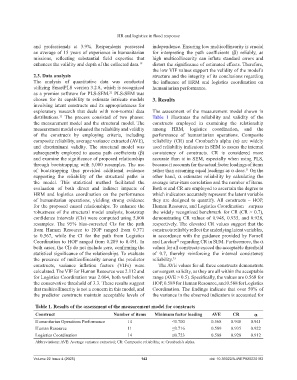
of the constructs by employing criteria, including performance of humanitarian operations. Composite
composite reliability, average variance extracted (AVE), reliability (CR) and Cronbach’s alpha (α) are widely
and discriminant validity. The structural model was used reliability indicators in SEM to assess the internal
subsequently employed to assess path coefficients (β) consistency of constructs. CR is considered more
and examine the significance of proposed relationships accurate than α in SEM, especially when using PLS,
through bootstrapping with 5,000 resamples. The use because it accounts for the actual factor loadings of items
of bootstrapping thus provided additional evidence rather than assuming equal loadings as α does. On the
11
supporting the reliability of the structural paths in other hand, α estimates reliability by calculating the
the model. This statistical method facilitated the average inter-item correlation and the number of items.
evaluation of both direct and indirect impacts of Both α and CR are employed to ascertain the degree to
HRM and logistics coordination on the performance which indicators accurately represent the latent variable
of humanitarian operations, yielding strong evidence they are designed to quantify. All constructs – HOP,
for the proposed causal relationships. To enhance the Human Resource, and Logistics Coordination – surpass
robustness of the structural model analysis, bootstrap the widely recognized benchmark for CR (CR > 0.7),
confidence intervals (CIs) were computed using 5,000 demonstrating CR values of 0.948, 0.935, and 0.928,
resamples. The 95% bias-corrected CIs for the path respectively. The elevated CR values suggest that the
from Human Resource to HOP ranged from 0.371 constructs reliably reflect the underlying latent variables,
to 0.567, while the CI for the path from Logistics in accordance with the guidance provided by Fornell
Coordination to HOP ranged from 0.289 to 0.491. In and Larcker regarding CR in SEM. Furthermore, the α
22
both cases, the CIs do not include zero, confirming the values for all constructs exceed the acceptable threshold
statistical significance of the relationships. To evaluate of 0.7, thereby reinforcing the internal consistency
the presence of multicollinearity among the predictor reliability. 23
constructs, variance inflation factors (VIFs) were The AVE values for all three constructs demonstrate
calculated. The VIF for Human Resource was 2.112 and convergent validity, as they are all within the acceptable
for Logistics Coordination was 2.004, both well below range (AVE > 0.5). Specifically, the values are 0.568 for
the conservative threshold of 3.3. These results suggest HOP, 0.589 for Human Resource, and 0.588 for Logistics
that multicollinearity is not a concern in this model, and Coordination. The findings indicate that over 50% of
the predictor constructs maintain acceptable levels of the variance in the observed indicators is accounted for
Table 1. Results of the assessment of the measurement model for constructs
Construct Number of items Minimum factor loading AVE CR α
Humanitarian Operations Performance 14 ≤0.700 0.568 0.948 0.941
Human Resource 11 ≤0.716 0.589 0.935 0.922
Logistics Coordination 14 ≤0.723 0.588 0.928 0.912
Abbreviations: AVE: Average variance extracted; CR: Composite reliability; α: Cronbach’s alpha.
Volume 22 Issue 4 (2025) 143 doi: 10.36922/AJWEP025220182