
Page 66 - AJWEP-22-4
P. 66
Basu
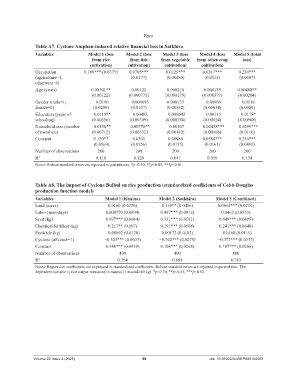
Table A7. Cyclone Amphan‑induced relative financial loss in Satkhira
Variables Model 1 (loss Model 2 (loss Model 3 (loss Model 4 (loss Model 5 (total
from rice from fish from vegetable from other crop loss)
cultivation) cultivation) cultivation) cultivation)
Occupation 0.109*** (0.0375) 0.0705*** 0.0125*** 0.0317*** 0.230***
(agriculture=1, (0.0177) (0.00480) (0.0115) (0.0607)
otherwise=0)
Age (years) 0.00301** 0.00122 0.000210 0.000139 0.00488**
(0.00122) (0.000775) (0.000179) (0.000377) (0.00204)
Gender (male=1, −0.0190 −0.000693 0.000133 −0.00966 −0.0518
female=0) (0.0299) (0.0157) (0.00552) (0.00634) (0.0429)
Education (years of −0.0119** −0.00482 −0.000642 −0.00115 −0.0178*
schooling) (0.00556) (0.00309) (0.000780) (0.00154) (0.00908)
Household size (number −0.0158** −0.00770** −0.00107 −0.00438*** −0.0299***
of members) (0.00715) (0.00332) (0.00142) (0.00166) (0.0110)
Constant 0.130** 0.0391 0.00986 0.0584*** 0.234***
(0.0569) (0.0356) (0.0135) (0.0161) (0.0882)
Number of observations 200 200 200 200 200
R 2 0.110 0.128 0.047 0.056 0.134
Notes: Robust standard errors are reported in parentheses. *p<0.10, **p<0.05, ***p<0.01.
Table A8. The impact of Cyclone Bulbul on rice production (standardized coefficients of Cobb‑Douglas
production function model)
Variables Model 1 (Khulna) Model 2 (Satkhira) Model 3 (Combined)
Land (acres) 0.0160 (0.0226) 0.116** (0.0456) 0.0614*** (0.0214)
Labor (man-days) 0.000770 (0.0394) 0.437*** (0.0812) 0.0462 (0.0333)
Seed (kg) 0.697*** (0.0644) 0.331*** (0.0591) 0.649*** (0.0495)
Chemical fertilizer (kg) 0.217** (0.107) 0.191*** (0.0508) 0.241*** (0.0840)
Pesticide (kg) −0.00892 (0.0128) 0.00172 (0.0183) −0.0168 (0.0111)
Cyclone (affected=1) −0.503*** (0.0633) −0.302*** (0.0275) −0.373*** (0.0337)
Constant 0.348*** (0.0419) 0.108*** (0.0268) 0.187*** (0.0266)
Number of observations 400 400 800
R 2 0.754 0.888 0.783
Notes: Regression coefficients are expressed in standardized coefficients. Robust standard errors are reported in parentheses. The
dependent variable is rice output measured in maund (1 maund=40 kg). *p<0.10, **p<0.05, ***p<0.01.
Volume 22 Issue 4 (2025) 58 doi: 10.36922/AJWEP025100063