
Page 68 - AJWEP-22-4
P. 68
Basu
Table A11. Cyclone Bulbul‑induced relative financial loss in Satkhira
Variables Model 1 (loss Model 2 (loss Model 3 (loss Model 4 (loss Model 5
from rice from fish from vegetable from other crop (total loss)
cultivation) cultivation) cultivation) cultivation)
Occupation (agriculture=1, 0.126** 0.0353*** 0.0339** 0.0494*** 0.246***
otherwise=0) (0.0607) (0.0123) (0.0165) (0.0188) (0.0901)
Age (years) 0.00382** 0.000148 0.000477 0.000396 0.00325
(0.00179) (0.000428) (0.000454) (0.000566) (0.00284)
Gender (male=1, female=0) −0.0397 −0.0109* −0.00959 −0.00980 −0.0712
(0.0345) (0.00625) (0.00820) (0.0117) (0.0498)
Education (years of −0.0108 −0.00234 −0.00212 −0.00420* −0.0212
schooling) (0.00959) (0.00162) (0.00175) (0.00234) (0.0138)
Household size (number of −0.0222** −0.00487*** −0.00323** −0.00507** −0.0286**
members) (0.0103) (0.00175) (0.00149) (0.00232) (0.0144)
Constant 0.146* 0.0697*** 0.0297*** 0.0706*** 0.345***
(0.0796) (0.0171) (0.0105) (0.0209) (0.115)
Number of observations 200 200 200 200 200
R 2 0.060 0.067 0.031 0.053 0.070
Notes: Robust standard errors are reported in parentheses. *p<0.10, **p<0.05, ***p<0.01.
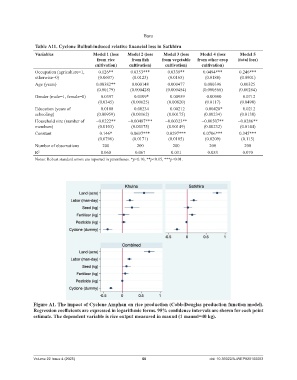
Figure A1. The impact of Cyclone Amphan on rice production (Cobb‑Douglas production function model).
Regression coefficients are expressed in logarithmic forms. 95% confidence intervals are shown for each point
estimate. The dependent variable is rice output measured in maund (1 maund=40 kg).
Volume 22 Issue 4 (2025) 60 doi: 10.36922/AJWEP025100063