
Page 67 - AJWEP-22-4
P. 67
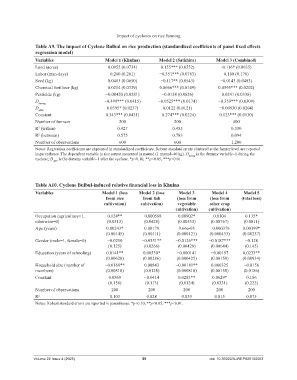
Impact of cyclones on rice farming

                 Table A9. The impact of Cyclone Bulbul on rice production (standardized coefficients of panel fixed effects
                 regression model)

                 Variables                     Model 1 (Khulna)        Model 2 (Satkhira)       Model 3 (Combined)
                 Land (acres)                    0.0952 (0.0734)        0.155*** (0.0552)         -0.116* (0.0635)
                 Labor (man-days)                 0.260 (0.201)        −0.351*** (0.0783)           0.180 (0.178)
                 Seed (kg)                       0.0483 (0.0650)        −0.117** (0.0543)         −0.0143 (0.0483)
                 Chemical fertilizer (kg)        0.0214 (0.0339)       0.0666*** (0.0149)        0.0595*** (0.0202)
                 Pesticide (kg)                 −0.00420 (0.0281)       −0.0124 (0.0826)           0.0241 (0.0338)
                 D                             −0.499*** (0.0415)      −0.0525*** (0.0174)       −0.359*** (0.0309)
                  during
                 D                              0.0395* (0.0237)         0.0122 (0.0121)          −0.00930 (0.0204)
                  after
                 Constant                       0.343*** (0.0431)      −0.274*** (0.0224)         0.123*** (0.0130)
                 Number of farmers                   200                      200                       400
                 R  (within)                         0.427                   0.455                     0.330
                  2
                 R  (between)                        0.575                   0.783                     0.094
                  2
                 Number of observations              600                      600                      1,200
                 Notes: Regression coefficients are expressed in standardized coefficients. Robust standard errors clustered at the farmer level are reported
                 in parentheses. The dependent variable is rice output measured in maund (1 maund=40 kg). D during  is the dummy variable=1 during the
                 cyclone; D   is the dummy variable=1 after the cyclone. *p<0.10, **p<0.05, ***p<0.01.
                        after


                 Table A10. Cyclone Bulbul‑induced relative financial loss in Khulna
                 Variables                    Model 1 (loss   Model 2 (loss     Model 3       Model 4       Model 5
                                                from rice       from fish      (loss from     (loss from   (total loss)
                                               cultivation)    cultivation)    vegetable     other crop
                                                                              cultivation)   cultivation)
                 Occupation (agriculture=1,     0.124**         −0.000588      0.00902*        0.0104        0.135*
                 otherwise=0)                   (0.0513)        (0.0428)       (0.00533)      (0.00767)     (0.0811)
                 Age (years)                    0.00243*         0.00179        9.66e-05     −0.000370      0.00399*
                                                (0.00145)       (0.00111)      (0.000121)    (0.000433)     (0.00237)
                 Gender (male=1, female=0)      −0.0210         −0.0551**     −0.0126***     −0.0187***      −0.128
                                                 (0.125)        (0.0266)       (0.00429)      (0.00644)      (0.145)
                 Education (years of schooling)  0.0141**       0.00530*       −0.000141      −0.00197      0.0233**
                                                (0.00628)       (0.00286)      (0.000425)     (0.00159)     (0.00934)
                 Household size (number of     −0.0168**         0.00843      −0.00181**      0.000325      −0.0156
                 members)                       (0.00818)       (0.0128)       (0.000810)     (0.00158)     (0.0186)
                 Constant                        0.0869          −0.0414       0.0283**       0.0629*         0.186
                                                 (0.156)         (0.113)        (0.0124)      (0.0331)       (0.222)
                 Number of observations           200             200             200           200           200
                 R 2                             0.103            0.028          0.039         0.015          0.075
                 Notes: Robust standard errors are reported in parentheses. *p<0.10, **p<0.05, ***p<0.01.


                Volume 22 Issue 4 (2025)                        59                           doi: 10.36922/AJWEP025100063