
Page 64 - AJWEP-22-4
P. 64
Basu
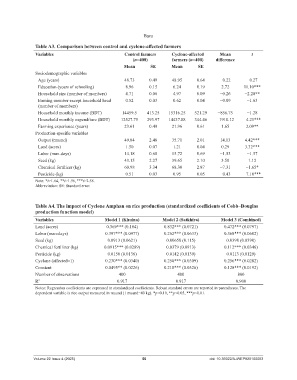
Table A3. Comparison between control and cyclone‑affected farmers
Variables Control farmers Cyclone‑affected Mean t
(n=400) farmers (n=400) difference
Mean SE Mean SE
Sociodemographic variables
Age (years) 48.73 0.49 48.95 0.64 −0.22 −0.27
Education (years of schooling) 8.96 0.15 6.24 0.19 2.72 11.10***
Household size (number of members) 4.71 0.06 4.97 0.09 −0.26 −2.20**
Earning member except household head 0.52 0.03 0.62 0.04 −0.09 −1.63
(number of members)
Household monthly income (BDT) 14459.5 413.25 15316.25 521.29 −856.75 −1.28
Household monthly expenditure (BDT) 12527.75 293.97 14437.88 344.46 −1910.12 −4.21***
Farming experience (years) 23.61 0.49 21.96 0.61 1.65 2.09**
Production-specific variables
Output (maund) 49.84 2.48 35.71 2.01 14.13 4.42***
Land (acres) 1.50 0.07 1.21 0.04 0.29 3.32***
Labor (man-days) 14.18 0.68 15.72 0.69 −1.53 −1.57
Seed (kg) 43.15 2.27 39.65 2.10 3.50 1.12
Chemical fertilizer (kg) 60.98 3.34 68.30 2.87 −7.31 −1.65*
Pesticide (kg) 0.51 0.03 0.95 0.05 −0.43 −7.10***
Note: *t>1.64, **t>1.96, ***t>2.58.
Abbreviation: SE: Standard error.
Table A4. The impact of Cyclone Amphan on rice production (standardized coefficients of Cobb–Douglas
production function model)
Variables Model 1 (Khulna) Model 2 (Satkhira) Model 3 (Combined)
Land (acres) 0.369*** (0.104) 0.832*** (0.0721) 0.472*** (0.0797)
Labor (man-days) 0.397*** (0.0977) 0.262*** (0.0633) 0.368*** (0.0602)
Seed (kg) 0.0913 (0.0621) 0.00658 (0.115) 0.0398 (0.0390)
Chemical fertilizer (kg) 0.0915*** (0.0289) 0.0379 (0.0913) 0.112*** (0.0346)
Pesticide (kg) 0.0150 (0.0136) 0.0142 (0.0139) 0.0113 (0.0129)
Cyclone (affected=1) 0.230*** (0.0340) 0.250*** (0.0309) 0.256*** (0.0282)
Constant 0.0495** (0.0226) 0.218*** (0.0326) 0.128*** (0.0192)
Number of observations 400 400 800
R 2 0.917 0.917 0.900
Notes: Regression coefficients are expressed in standardized coefficients. Robust standard errors are reported in parentheses. The
dependent variable is rice output measured in maund (1 maund=40 kg). *p<0.10, **p<0.05, ***p<0.01.
Volume 22 Issue 4 (2025) 56 doi: 10.36922/AJWEP025100063