
Page 65 - AJWEP-22-4
P. 65
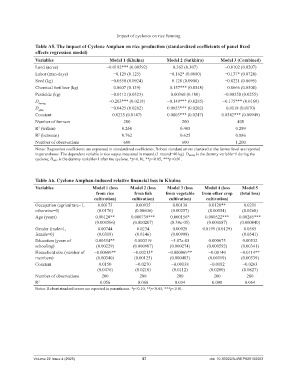
Impact of cyclones on rice farming

                 Table A5. The impact of Cyclone Amphan on rice production (standardized coefficients of panel fixed
                 effects regression model)

                 Variables                       Model 1 (Khulna)         Model 2 (Satkhira)      Model 3 (Combined)
                 Land (acres)                   −0.0182*** (0.00592)         0.362 (0.307)          −0.0102 (0.0207)
                 Labor (man-days)                  −0.129 (0.125)           −0.162* (0.0880)        −0.137* (0.0728)
                 Seed (kg)                        −0.0550 (0.0924)           0.120 (0.0908)         −0.0221 (0.0695)
                 Chemical fertilizer (kg)          0.0607 (0.139)          −0.157*** (0.0548)       −0.0666 (0.0508)
                 Pesticide (kg)                   −0.0112 (0.0323)          0.00360 (0.100)         −0.00250 (0.0255)
                 D                               −0.203*** (0.0218)        −0.149*** (0.0285)      −0.175*** (0.0160)
                  during
                 D                                −0.0425 (0.0262)         0.0653*** (0.0202)        0.0118 (0.0170)
                  after
                 Constant                          0.0235 (0.0147)         0.0803*** (0.0247)      0.0542*** (0.00949)
                 Number of farmers                     200                       200                     400
                 R  (within)                           0.260                    0.405                    0.299
                  2
                 R  (between)                          0.762                    0.625                    0.886
                  2
                 Number of observations                600                       600                     1,200
                 Notes: Regression coefficients are expressed in standardized coefficients. Robust standard errors clustered at the farmer level are reported
                 in parentheses. The dependent variable is rice output measured in maund (1 maund=40 kg). D during is the dummy variable=1 during the
                 cyclone; D after is the dummy variable=1 after the cyclone. *p<0.10, **p<0.05, ***p<0.01.


                 Table A6. Cyclone Amphan‑induced relative financial loss in Khulna

                 Variables                Model 1 (loss   Model 2 (loss    Model 3 (loss   Model 4 (loss    Model 5
                                           from rice        from fish     from vegetable   from other crop   (total loss)
                                          cultivation)     cultivation)    cultivation)     cultivation)
                 Occupation (agriculture=1,   0.00173        0.00935         0.00138         0.0120**       0.0211
                 otherwise=0)               (0.0176)         (0.00606)      (0.00257)        (0.00554)      (0.0268)
                 Age (years)               0.00128**       0.000739***      0.000156*      0.000522***    0.00285***
                                           (0.000506)       (0.000207)      (8.39e-05)      (0.000187)     (0.000840)
                 Gender (male=1,            0.00744          0.0234          0.00928      0.0199 (0.0129)   0.0585
                 female=0)                  (0.0318)         (0.0146)       (0.00999)                       (0.0541)
                 Education (years of       0.00554**        0.000319        −5.87e-05        0.000675       0.00532
                 schooling)                (0.00229)        (0.000907)      (0.000274)      (0.000592)     (0.00341)
                 Household size (number of   −0.00689**     −0.00213*      −0.000969**       −0.00140      −0.0114**
                 members)                  (0.00340)        (0.00125)       (0.000483)       (0.00119)     (0.00539)
                 Constant                    0.0150          −0.0270        −0.00138         −0.0182        −0.0263
                                            (0.0476)         (0.0210)        (0.0112)        (0.0200)       (0.0827)
                 Number of observations       200              200             200             200            200
                 R 2                         0.056            0.068           0.034           0.090          0.064
                 Notes: Robust standard errors are reported in parentheses. *p<0.10, **p<0.05, ***p<0.01.


                Volume 22 Issue 4 (2025)                        57                           doi: 10.36922/AJWEP025100063