
Page 90 - AJWEP-22-4
P. 90
Tran, et al.
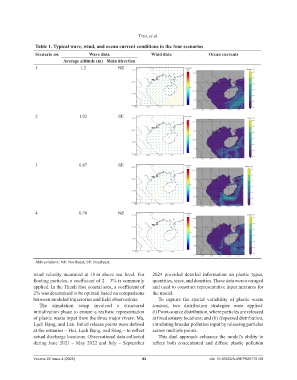
Table 1. Typical wave, wind, and ocean current conditions in the four scenarios
Scenario no. Wave data Wind data Ocean currents
Average altitude (m) Main direction
1 1.2 NE
2 1.02 SE
3 0.87 SE
4 0.78 NE
Abbreviations: NE: Northeast; SE: Southeast.
wind velocity measured at 10 m above sea level. For 2024 provided detailed information on plastic types,
floating particles, a coefficient of 2 – 3% is commonly quantities, sizes, and densities. These data were averaged
applied. In the Thanh Hoa coastal area, a coefficient of and used to construct representative input mixtures for
2% was determined to be optimal based on comparisons the model.
between modeled trajectories and field observations. To capture the spatial variability of plastic waste
The simulation setup involved a structured sources, two distribution strategies were applied:
initialization phase to ensure a realistic representation (i) Point-source distribution, where particles are released
of plastic waste input from the three major rivers: Ma, at fixed estuary locations; and (ii) dispersed distribution,
Lạch Bạng, and Lèn. Initial release points were defined simulating broader pollution input by releasing particles
at the estuaries – Hoi, Lạch Bạng, and Sùng – to reflect across multiple points.
actual discharge locations. Observational data collected This dual approach enhances the model’s ability to
during June 2021 – May 2022 and July – September reflect both concentrated and diffuse plastic pollution
Volume 22 Issue 4 (2025) 82 doi: 10.36922/AJWEP025170129