
Page 137 - AJWEP-22-5
P. 137
Climate trend and policy in Lake Tana Basin
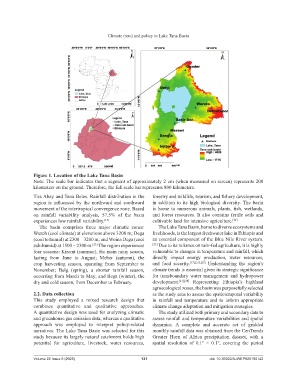
Figure 1. Location of the Lake Tana Basin
Note: The scale bar indicates that a segment of approximately 2 cm (when measured on screen) represents 200
kilometers on the ground. Therefore, the full scale bar represents 800 kilometers.
Tiss Abay and Tana Beles. Rainfall distribution in the forestry and wildlife, tourism, and fishery development,
region is influenced by the northward and southward in addition to its high biological diversity. The basin
movement of the intertropical convergence zone. Based is home to numerous animals, plants, fish, wetlands,
on rainfall variability analysis, 57.5% of the basin and forest resources. It also contains fertile soils and
experiences low rainfall variability. [13] cultivable land for intensive agriculture. [24]
The basin comprises three major climatic zones: The Lake Tana Basin, home to diverse ecosystems and
Wurch (cool climate) at elevations above 3200 m; Dega livelihoods, is the largest freshwater lake in Ethiopia and
(cool to humid) at 2300 – 3200 m; and Woina Dega (cool an essential component of the Blue Nile River system.
sub-humid) at 1500 – 2300 m. The region experiences [25] Due to its reliance on rain-fed agriculture, it is highly
[23]
four seasons: Kiremt (summer), the main rainy season, vulnerable to changes in temperature and rainfall, which
lasting from June to August; Meher (autumn), the directly impact energy production, water resources,
crop harvesting season, spanning from September to and food security. [17],[21],[26] Understanding the region’s
November; Belg (spring), a shorter rainfall season, climate trends is essential given its strategic significance
occurring from March to May; and Bega (winter), the for transboundary water management and hydropower
dry and cold season, from December to February. development. [27],[28] Representing Ethiopia’s highland
agroecological zones, the basin was purposefully selected
2.2. Data collection as the study area to assess the spatiotemporal variability
This study employed a mixed research design that in rainfall and temperature and to inform appropriate
combines quantitative and qualitative approaches. climate change adaptation and mitigation strategies.
A quantitative design was used for analyzing climatic The study utilized both primary and secondary data to
and greenhouse gas emission data, whereas a qualitative assess rainfall and temperature variabilities and spatial
approach was employed to interpret policy-related dynamics. A complete and accurate set of gridded
narratives. The Lake Tana Basin was selected for this monthly rainfall data was obtained from the CenTrends
study because its largely natural catchment holds high Greater Horn of Africa precipitation dataset, with a
potential for agriculture, livestock, water resources, spatial resolution of 0.1° × 0.1°, covering the period
Volume 22 Issue 5 (2025) 131 doi: 10.36922/AJWEP025190142