
Page 138 - AJWEP-22-5
P. 138
Messel, et al.
1900 – 2023. Monthly temperature data were sourced distribution, frequent missing data, and relatively short
from the Climate Research Unit (CRU) Time Series observation periods.
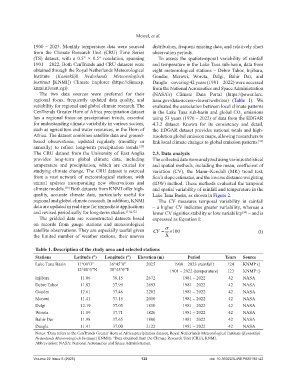
(TS) dataset, with a 0.5° × 0.5° resolution, spanning To assess the spatiotemporal variability of rainfall
1901 – 2022. Both CenTrends and CRU datasets were and temperature in the Lake Tana sub-basin, data from
obtained through the Royal Netherlands Meteorological eight meteorological stations – Debre Tabor, Injibara,
Institute (Koninklijk Nederlands Meteorologisch Gondar, Merawi, Woreta, Delgi, Bahir Dar, and
Instituut [KNMI]) Climate Explorer (https://climexp. Dangla – covering 42 years (1981 – 2022) were accessed
knmi.nl/start.cgi). from the National Aeronautics and Space Administration
The two data sources were preferred for their (NASA’s) Climate Data Portal (https://power.larc.
regional focus, frequently updated data quality, and nasa.gov/data-access-viewer/websites) (Table 1). We
suitability for regional and global climate research. The evaluated the association between local climate patterns
CenTrends Greater Horn of Africa precipitation dataset in the Lake Tana sub-basin and global CO emissions
2
has a regional focus on precipitation trends, essential using 53 years (1970 – 2022) of data from the EDGAR
for understanding climate variability in various sectors, 4.3.2 dataset. Known for its consistency and detail,
such as agriculture and water resources, in the Horn of the EDGAR dataset provides national totals and high-
Africa. The dataset combines satellite data and ground- resolution global emission maps, allowing researchers to
based observations, updated regularly (monthly or link local climate changes to global emission patterns. [33]
annually) to reflect long-term precipitation trends.
[29]
The CRU dataset from the University of East Anglia 2.3. Data analysis
provides long-term global climate data, including The collected data were analyzed using various statistical
temperature and precipitation, which are crucial for and spatial methods, including the mean, coefficient of
studying climate change. The CRU dataset is sourced variation (CV), the Mann–Kendall (MK) trend test,
from a vast network of meteorological stations, with Sen’s slope estimator, and the inverse distance weighting
annual updates incorporating new observations and (IDW) method. These methods evaluated the temporal
climate models. Both datasets from KNMI offer high- and spatial variability of rainfall and temperature in the
[30]
quality, accurate climate data, particularly useful for Lake Tana Basin, as shown in Figure 2.
regional and global climate research. In addition, KNMI The CV measures temporal variability in rainfall
data are updated in real-time for immediate applications – a higher CV indicates greater variability, whereas a
and revised periodically for long-term studies. [31],[32] lower CV signifies stability or low variability – and is
[34]
The gridded data are reconstructed datasets based expressed as Equation I:
on records from gauge stations and meteorological
σ
satellite observations. They are especially useful given CV = 100× (I)
the limited number of weather stations, their uneven X
Table 1. Description of the study area and selected stations
Stations Latitude (°) Longitude (°) Elevation (m) Period Years Source
Lake Tana Basin 11°00’0” 36°45’0” 2025 1900 – 2023 (rainfall) 124 KNMI ()
a
– 12°40’0”N – 38°45’0”E 1901 – 2022 (temperature) 123 KNMI ()
b
Injibara 11.06 36.15 2672 1981 – 2022 42 NASA
Debre Tabor 11.83 37.99 2693 1981 – 2022 42 NASA
Gonder 12.61 37.46 2202 1981 – 2022 42 NASA
Merawi 11.41 37.15 2010 1981 – 2022 42 NASA
Delgi 12.19 37.05 1810 1981 – 2022 42 NASA
Woreta 11.89 37.71 1826 1981 – 2022 42 NASA
Bahir Dar 11.98 37.65 1800 1981 – 2022 42 NASA
Dangla 11.41 37.00 2122 1981 – 2022 42 NASA
Notes: Data refers to the CenTrends Greater Horn of Africa precipitation dataset, Royal Netherlands Meteorological Institute (Koninklijk
a
Nederlands Meteorologisch Instituut [KNMI]). Data obtained from the Climate Research Unit (CRU), KNMI.
b
Abbreviation: NASA: National Aeronautics and Space Administration.
Volume 22 Issue 5 (2025) 132 doi: 10.36922/AJWEP025190142