
Page 139 - AJWEP-22-5
P. 139
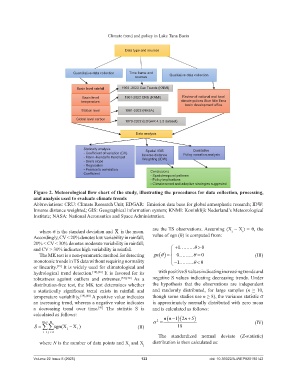
Climate trend and policy in Lake Tana Basin
Data type and sources
Quantitative data collection Time frame and Qualitative data collection
sources
Basin level rainfall 1900 -2023 Cen Trends (KNMI)
Basin level 1901-2022 CRU (KNMI) Review of national and local
temperature climate polices Blue Nile Tana
basin development office
Station level 1981-2022 (NASA)
Global level carbon
1970-2022 (EDGAR 4.3.2 dataset)
Data analysis
Statically analysis Spatial /GIS Qualitative
- Coefficient of variation (CV) Inverse distance Policy narration analysis
- Mann–Kendall’s trend test Weighting (IDW)
- Sen’s slope
- Regression
- Pearson’s correlation Conclusions
Coefficient
- Spatiotemporal patterns
- Policy implications
- Climate-smart and adaptive strategies suggested
Figure 2. Meteorological flow chart of the study, illustrating the procedures for data collection, processing,
and analysis used to evaluate climate trends
Abbreviations: CRU: Climate Research Unit; EDGAR: Emission data base for global atmospheric research; IDW:
Inverse distance weighted; GIS: Geographical information system; KNMI: Koninklijk Nederland’s Meteorological
Institute; NASA: National Aeronautics and Space Administration.
where σ is the standard deviation and X is the mean. are the TS observations. Assuming (X – X ) = θ, the
i
j
Accordingly, CV < 20% denotes low variability in rainfall; value of sgn (θ) is computed from:
20% < CV < 30% denotes moderate variability in rainfall;
θ
and CV > 30% indicates high variability in rainfall. + 1……… > 0
The MK test is a non-parametric method for detecting gn ( ) θ 0……… = 0 (III)
θ =
monotonic trends in TS data without requiring normality − 1……… < 0
θ
or linearity. It is widely used for climatological and
[35]
hydrological trend detection. [10],[36] It is favored for its with positive S values indicating increasing trends and
robustness against outliers and extremes. [37],[38] As a negative S values indicating decreasing trends. Under
distribution-free test, the MK test determines whether the hypothesis that the observations are independent
a statistically significant trend exists in rainfall and and randomly distributed, for large samples (n ≥ 10,
temperature variability. [39],[40] A positive value indicates though some studies use n ≥ 8), the variance statistic σ
an increasing trend, whereas a negative value indicates is approximately normally distributed with zero mean
a decreasing trend over time. The statistic S is and is calculated as follows:
[41]
calculated as follows:
N1 N− σ 2 = ( nn − 1 )(2n + ) 5 (IV)
S = ∑∑ sgn (X − X ) (II) 18
j
i
=
i 1 j i 1
= +
The standardized normal deviate (Z-statistic)
where N is the number of data points and X and X j distribution is then calculated as:
i
Volume 22 Issue 5 (2025) 133 doi: 10.36922/AJWEP025190142