
Page 141 - AJWEP-22-5
P. 141
Climate trend and policy in Lake Tana Basin
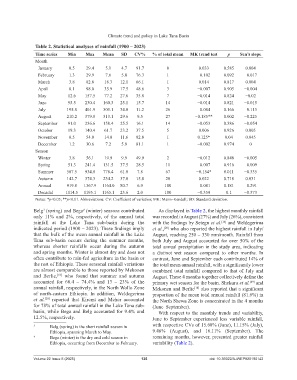
Table 2. Statistical analyses of rainfall (1900 – 2023)
Time series Min Max Mean SD CV% % of total mean MK trend test p Sen’s slope
Month
January 0.5 29.4 5.1 4.7 91.7 0 0.033 0.585 0.004
February 1.3 29.9 7.6 5.8 76.3 1 −0.102 0.092 −0.017
March 3.8 82.8 18.3 12.1 66.1 1 0.014 0.817 0.004
April 8.1 98.0 35.9 17.5 48.6 3 −0.007 0.905 −0.004
May 12.6 157.5 77.2 27.6 35.8 7 −0.014 0.824 −0.02
June 95.5 230.4 160.3 25.1 15.7 14 −0.014 0.821 −0.015
July 195.8 401.9 305.1 34.0 11.2 26 −0.084 0.166 −0.113
August 210.2 379.8 313.1 29.6 9.5 27 −0.185** 0.002 −0.225
September 91.0 236.6 158.4 25.5 16.1 14 −0.053 0.386 −0.054
October 19.3 140.4 61.7 23.2 37.5 5 0.006 0.926 0.005
November 0.5 54.0 14.0 11.6 82.8 1 0.125* 0.04 0.045
December 1.2 30.6 7.2 5.9 81.1 1 −0.002 0.974 0
Season
Winter 3.8 56.1 19.9 9.9 49.9 2 −0.012 0.848 −0.005
Spring 51.3 241.4 131.5 37.5 28.5 11 −0.007 0.916 −0.009
Summer 567.5 934.8 778.4 61.0 7.8 67 −0.154* 0.011 −0.335
Autumn 142.7 374.3 234.2 37.0 15.8 20 0.022 0.718 0.031
Annual 919.8 1367.9 1164.0 80.7 6.9 100 −0.081 0.181 −0.291
Decadal 1114.5 1195.1 1165.1 23.6 2.0 100 −0.359 0.1 −0.373
Notes: *p<0.05; **p<0.01. Abbreviations: CV: Coefficient of variation; MK: Mann–Kendall; SD: Standard deviation.
Belg (spring) and Bega (winter) seasons contributed As displayed in Table 2, the highest monthly rainfall
4
3
only 11% and 2%, respectively, of the annual total was recorded in August (27%) and July (26%), consistent
rainfall at the Lake Tana sub-basin during the with the findings by Setegn et al. and Weldegerima
[16]
indicated period (1900 – 2023). These findings imply et al., who also reported the highest rainfall in July/
[20]
that the bulk of the mean annual rainfall in the Lake August, reaching 250 – 330 mm/month. Rainfall from
Tana sub-basin occurs during the summer months, both July and August accounted for over 50% of the
whereas shorter rainfalls occur during the autumn total annual precipitation in the study area, indicating
and spring months. Winter is almost dry and does not a distinct wet season compared to other months. In
often contribute to rain-fed agriculture in the basin or contrast, June and September each contributed 14% of
the rest of Ethiopia. These seasonal rainfall variations the total mean annual rainfall, with a significantly lower
are almost comparable to those reported by Mekonen combined total rainfall compared to that of July and
and Berlie, [10] who found that summer and autumn August. These 4 months together collectively define the
accounted for 68.4 – 74.4% and 13 – 23% of the primary wet season for the basin. Shekuru et al. and
[49]
annual rainfall, respectively, in the North Wollo Zone Mekonen and Berlie also reported that a significant
[10]
of north-eastern Ethiopia. In addition, Weldegerima proportion of the mean total annual rainfall (81.6%) in
et al. [20] reported that Kiremt and Meher accounted the North Shewa Zone is concentrated in the 4 months
for 78% of total annual rainfall in the Lake Tana sub- (June–September).
basin, while Bega and Belg accounted for 9.4% and With respect to the monthly trends and variability,
12.5%, respectively. June to September experienced less variable rainfall,
3 Belg (spring) is the short rainfall season in with respective CVs of 15.68% (June), 11.15% (July),
Ethiopia, spanning March to May. 9.46% (August), and 16.11% (September). The
4 Bega (winter) is the dry and cold season in remaining months, however, presented greater rainfall
Ethiopia, occurring from December to February. variability (Table 2).
Volume 22 Issue 5 (2025) 135 doi: 10.36922/AJWEP025190142