
Page 146 - AJWEP-22-5
P. 146
Messel, et al.
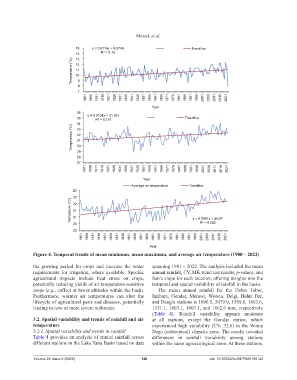
15 y = 0.0116x + 9.5746 Trendline
14 R² = 0.18
13
Temperature (°C) 12
11
10
9
8
7
1901 1906 1911 1916 1921 1926 1931 1936 1941 1946 1951 1956 1961 1966 1971 1976 1981 1986 1991 1996 2001 2006 2011 2016 2021
Year
36 y = 0.0104x + 31.042
35 R² = 0.151 Trendline
34
Temperature (°C) 32
33
31
30
29
28
27
1901 1906 1911 1916 1921 1926 1931 1936 1941 1946 1951 1956 1961 1966 1971 1976 1981 1986 1991 1996 2001 2006 2011 2016 2021
Year
Average air temperature Trendline
23
22
Temprature (°C) 22
21
21
R² = 0.282
20 y = 0.0081x + 20.67
20
1901 1906 1911 1916 1921 1926 1931 1936 1941 1946 1951 1956 1961 1966 1971 1976 1981 1986 1991 1996 2001 2006 2011 2016 2021
Year
Figure 4. Temporal trends of mean minimum, mean maximum, and average air temperature (1900 – 2022)
the growing period for crops and increase the water spanning 1981 – 2022. The analysis included the mean
requirements for irrigation, where available. Specific annual rainfall, CV, MK trend test results, p-values, and
agricultural impacts include heat stress on crops, Sen’s slope for each location, offering insights into the
potentially reducing yields of air temperature-sensitive temporal and spatial variability of rainfall in the basin.
crops (e.g., coffee) at lower altitudes within the basin. The mean annual rainfall for the Debre Tabor,
Furthermore, warmer air temperatures can alter the Injibara, Gondar, Merawi, Woreta, Delgi, Bahir Dar,
lifecycle of agricultural pests and diseases, potentially and Dangla stations is 1090.5, 2079.9, 1589.8, 1862.6,
leading to new or more severe outbreaks. 1531.1, 1603.1, 1603.1, and 1862.6 mm, respectively
(Table 4). Rainfall variability appears moderate
3.2. Spatial variability and trends of rainfall and air at all stations, except the Gondar station, which
temperature experienced high variability (CV: 32.6) in the Woina
3.2.1. Spatial variability and trends in rainfall Dega (subtropical) climatic zone. The results revealed
Table 4 provides an analysis of annual rainfall across differences in rainfall variability among stations
different stations in the Lake Tana Basin based on data within the same agroecological zone. At these stations,
Volume 22 Issue 5 (2025) 140 doi: 10.36922/AJWEP025190142