Page 147 - AJWEP-22-5
P. 147

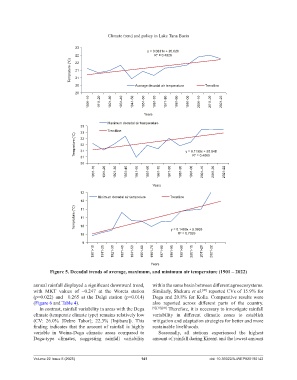
Climate trend and policy in Lake Tana Basin

                                  23
                                                                  y = 0.0831x + 20.626
                                  22                                 R² = 0.4826
                                Temprature (°C)  22

                                  21
                                  21
                                  20                         Average decadal air temperature  Trendline
                                  20
                                        1901-10  1911-20  1921-30  1931-40  1941-50  1951-60  1961-70  1971-80  1981-90  1991-00  2001-10  2011-20  2021-22


                                                                Years
                                                Maximum decadal air temperature
                                    33
                                    33          Trendline
                                  Temprature (°C)  32
                                    32
                                    31
                                                                                      R² = 0.4065
                                    31                                             y = 0.1139x + 30.948
                                    30
                                           1901-10  1911-20  1921-30  1931-40  1941-50  1951-60  1961-70  1971-80  1981-90  1991-00  2001-10  2011-20  2021-22


                                                                    Years
                                    12
                                            Minimum decadal air tempreture  Trendline
                                    12
                                  Temprature (°C)  10
                                     11
                                     11


                                                                               R² = 0.7025
                                    10                                      y = 0.1499x + 9.3633
                                     9
                                          1901-10  1911-20  1921-30  1931-40  1941-50  1951-60  1961-70  1971-80  1981-90  1991-00  2001-10  2011-20  2021-22


                                                                   Years
                       Figure 5. Decadal trends of average, maximum, and minimum air temperature (1901 – 2022)

                annual rainfall displayed a significant downward trend,   within the same basin between different agroecosystems.
                with  MKT  values  of  −0.247  at  the  Woreta  station   Similarly, Shekuru et al.  reported CVs of 15.9% for
                                                                                          [49]
                (p=0.022)  and  −0.265  at  the  Delgi  station  (p=0.014)   Dega and 20.8% for Kolla. Comparative results were
                (Figure 6 and Table 4).                             also  reported  across  different  parts  of  the  country.
                  In contrast, rainfall variability in areas with the Dega   [9],[10],[69]  Therefore, it is necessary to investigate rainfall
                climate (temperate climate type) remains relatively low   variability  in  different  climatic  zones  to  establish
                (CV:  26.0%  [Debre  Tabor];  22.3%  [Injibara]).  This   mitigation and adaptation strategies for better and more
                finding indicates that the amount of rainfall is highly   sustainable livelihoods.
                variable  in  Woina-Dega climatic  areas compared  to   Seasonally, all stations experienced  the highest
                Dega-type climates,  suggesting rainfall  variability   amount of rainfall during Kiremt and the lowest amount


                Volume 22 Issue 5 (2025)                       141                           doi: 10.36922/AJWEP025190142
   142   143   144   145   146   147   148   149   150   151   152