
Page 148 - AJWEP-22-5
P. 148
Messel, et al.
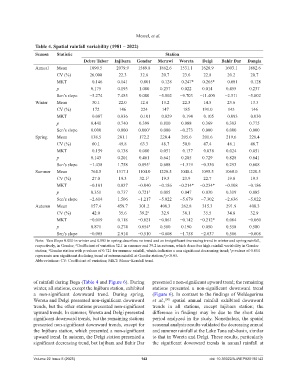
Table 4. Spatial rainfall variability (1981 – 2022)
Season Statistic Station
Debre Tabor Injibara Gondar Merawi Woreta Delgi Bahir Dar Dangla
Annual Mean 1090.5 2079.9 1589.8 1862.6 1531.1 1626.9 1603.1 1862.6
CV (%) 26.000 22.3 32.6 20.7 23.6 22.8 20.2 20.7
MKT −0.146 0.141 −0.001 −0.128 −0.247* −0.265* −0.081 −0.128
p 0.175 0.193 1.000 0.237 0.022 0.014 0.455 0.237
Sen’s slope −5.274 7.485 0.000 −5.802 −9.703 −11.400 −2.511 −5.802
Winter Mean 30.1 22.0 12.4 13.2 22.3 14.5 23.6 13.3
CV (%) 172 146 224 147 185 191.0 143 146
MKT −0.087 0.036 −0.101 −0.029 −0.194 −0.105 −0.093 −0.030
p 0.441 0.740 0.399 0.810 0.088 0.369 0.383 0.775
Sen’s slope 0.000 0.000 0.000 1 0.000 −0.273 0.000 0.000 0.000
Spring Mean 138.5 281.1 172.2 228.4 205.6 201.6 219.6 228.4
CV (%) 60.1 49.8 63.3 48.7 50.0 47.4 48.1 48.7
MKT −0.159 0.138 0.080 0.051 −0.137 −0.038 0.024 0.051
p 0.143 0.201 0.461 0.641 0.205 0.729 0.828 0.641
Sen’s slope −1.438 1.758 0.895 1 0.608 −1.319 −0.330 0.293 0.608
Summer Mean 764.5 1317.1 1104.0 1220.5 1040.4 1095.5 1068.0 1220.5
CV (%) 27.0 19.3 32.1 2 19.3 23.9 22.7 19.8 19.3
MKT −0.101 0.037 −0.040 −0.186 −0.214* −0.234* −0.108 −0.186
p 0.351 0.737 0.721 3 0.085 0.047 0.030 0.319 0.085
Sen’s slope −2.614 1.506 −1.217 −5.022 −5.679 −7.302 −2.636 −5.022
Autumn Mean 157.4 459.7 301.2 400.3 262.8 315.3 291.9 400.3
CV (%) 42.0 35.6 39.2 2 32.9 38.1 35.5 34.8 32.9
MKT −0.019 0.118 −0.021 −0.061 −0.142 −0.212* 0.064 −0.060
p 0.871 0.274 0.854 4 0.580 0.190 0.050 0.558 0.580
Sen’s slope −0.005 2.914 −0.510 −0.608 −1.758 −2.637 0.586 −0.608
Note: Sen Slope 0.000 in winter and 0.895 in spring describes no trend and an insignificant increasing trend in winter and spring rainfall,
1
respectively, in Gonder; Coefficient of variation 32.1 in summer and 39.2 in autumn, which describes high rainfall variability in Gonder
2
station; Gonder station with p-values of 0.721 for summer rainfall, which indicates a non significant decreasing trend; p-values of 0.854
4
3
represents non significant declining trend of autumn rainfall at Gonder station;*p<0.05.
Abbreviations: CV: Coefficient of variation; MKT: Mann–Kendall trend.
of rainfall during Bega (Table 4 and Figure 6). During presented a non-significant upward trend; the remaining
winter, all stations, except the Injibara station, exhibited stations presented a non-significant downward trend
a non-significant downward trend. During spring, (Figure 6). In contrast to the findings of Weldegerima
Woreta and Delgi presented non-significant downward et al., spatial annual rainfall exhibited downward
[20]
trends, but the other stations presented non-significant trends in all stations, except Injibara station; the
upward trends. In summer, Woreta and Delgi presented difference in findings may be due to the short data
significant downward trends, but the remaining stations period analyzed in the study. Nonetheless, the spatial
presented non-significant downward trends, except for seasonal analysis results validated the decreasing annual
the Injibara station, which presented a non-significant and summer rainfall at the Lake Tana sub-basin, similar
upward trend. In autumn, the Delgi station presented a to that in Woreta and Delgi. These results, particularly
significant decreasing trend, but Injibara and Bahir Dar the significant downward trends in annual rainfall at
Volume 22 Issue 5 (2025) 142 doi: 10.36922/AJWEP025190142