
Page 145 - AJWEP-22-5
P. 145
Climate trend and policy in Lake Tana Basin
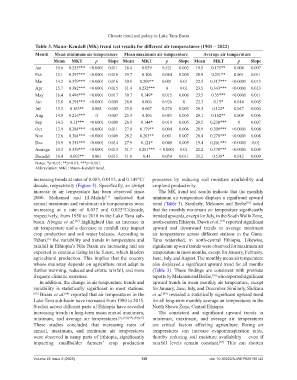
Table 3. Mann–Kendall (MK) trend test results for different air temperatures (1901 – 2022)
Month Mean minimum air temperature Mean maximum air temperature Average air temperature
Mean MKT p Slope Mean MKT p Slope Mean MKT p Slope
Jan 10.6 0.255*** <0.0001 0.011 28.4 0.039 0.521 0.002 19.5 0.175** 0.004 0.007
Feb 12.1 0.297*** <0.0001 0.016 29.7 0.106 0.084 0.005 20.9 0.211** 0.001 0.011
Mar 14.2 0.379*** <0.0001 0.016 30.9 0.209** 0.001 0.01 22.5 0.317*** <0.0001 0.013
Apr 15.7 0.382*** <0.0001 0.015 31.4 0.232*** 0 0.01 23.5 0.343*** <0.0001 0.013
May 16.4 0.498*** <0.0001 0.017 30.7 0.149* 0.015 0.006 23.5 0.35*** <0.0001 0.011
Jun 15.8 0.291*** <0.0001 0.009 28.8 0.006 0.926 0 22.3 0.15* 0.014 0.005
Jul 15.3 0.163** 0.008 0.005 25.8 0.067 0.276 0.003 20.5 0.122* 0.047 0.004
Aug 14.9 0.216*** 0 0.007 25.3 0.106 0.083 0.005 20.1 0.162** 0.008 0.006
Sep 14.3 0.31*** <0.0001 0.008 26.8 0.144* 0.019 0.005 20.5 0.238*** 0 0.007
Oct 13.9 0.384*** <0.0001 0.011 27.9 0.179** 0.004 0.006 20.9 0.309*** <0.0001 0.008
Nov 12.6 0.304*** <0.0001 0.009 28.2 0.203** 0.001 0.007 20.4 0.279*** <0.0001 0.008
Dec 10.9 0.354*** <0.0001 0.014 27.9 0.121* 0.049 0.005 19.4 0.261*** <0.0001 0.01
Average 10.3 0.339*** <0.0001 0.013 31.7 0.251*** < 0.0001 0.01 21.2 0.378*** <0.0001 0.008
Decadal 10.4 0.692** 0.001 0.015 31.8 0.41 0.059 0.011 21.2 0.538* 0.012 0.009
Notes: *p<0.05; **p<0.01; ***p<0.001.
Abbreviation: MKT: Mann–Kendall trend.
increasing trends at rates of 0.083, 0.0113, and 0.149°C/ processes by reducing soil moisture availability and
decade, respectively (Figure 5). Specifically, an abrupt cropland productivity.
increase in air temperature has been observed since The MK trend test results indicate that the monthly
2000. Mohamed and El-Mahdy indicated that minimum air temperature displays a significant upward
[11]
annual maximum and minimum air temperatures were trend (Table 3). Similarly, Mekonen and Berlie noted
[10]
increasing at a rate of 0.037 and 0.025°C/decade, that the monthly minimum air temperature significantly
respectively, from 1950 to 2018 in the Lake Tana sub- trended upwards, except for July, in the South Wollo Zone,
basin. Abegaz et al. highlighted that an increase in north-eastern Ethiopia. Dawit et al., reported significant
[62]
[63]
air temperature and a decrease in rainfall may impact upward and downward trends in average minimum
crop production and soil water balance. According to air temperatures across different stations in the Guna-
Tabari, the variability and trends in temperature and Tana watershed, in north-central Ethiopia. Likewise,
[6]
rainfall in Ethiopia’s Nile Basin are increasing and are significant upward trends were observed for maximum air
expected to continue rising in the future, which hinders temperature in most months, except for January, February,
agricultural production. This implies that the country June, July, and August. The monthly mean air temperature
whose mainstay depends on agriculture must adapt to also displayed a significant upward trend for all months
further warming, reduced and erratic rainfall, and more (Table 3). These findings are consistent with previous
frequent climatic extremes. reports by Mekonen and Berlie, who reported significant
[10]
In addition, the change in air temperature trends and upward trends in mean monthly air temperature, except
variability is statistically significant in most stations. for January, June, July, and December. Similarly, Shekuru
[64]
[63] Birara et al. reported that air temperatures in the et al. revealed a statistically significant upward trend
[49]
Lake Tana sub-basin have increased from 1980 to 2015. for all long-term monthly average air temperatures in the
Studies across different parts of Ethiopia have revealed North Shewa Zone, Central Ethiopia.
increasing trends in long-term mean annual maximum, The consistent and significant upward trends in
minimum, and average air temperatures. [9],[10],[49],[50],[57] minimum, maximum, and average air temperatures
These studies concluded that increasing rates of are critical factors affecting agriculture. Rising air
annual, maximum, and minimum air temperatures temperatures can increase evapotranspiration rates,
were observed in many parts of Ethiopia, significantly thereby reducing soil moisture availability – even if
impacting smallholder farmers’ crop production rainfall levels remain constant. This can shorten
[65]
Volume 22 Issue 5 (2025) 139 doi: 10.36922/AJWEP025190142