
Page 150 - AJWEP-22-5
P. 150
Messel, et al.
Table 5. Spatial trends of minimum, maximum, and mean air temperatures (1981 – 2022)
Air Statistic Station
temperature Debre Injibara Gondar Merawi Woreta Delgi Bahir Dangla
Tabor Dar
Average Mean 18.364 17.209 19.6 19.3 21.1 20.8 18.9 19.4
MKT 0.468*** 0.282** 0.343** 0.396*** 0.468*** 0.389*** 0.419*** 0.396***
p <0.0001 0.009 0.001 0.000 <0.0001 0.000 0.000 0.000
Sen’s slope 0.020 0.011 0.019 0.018 0.017 0.020 0.016 0.018
Minimum Mean 11.9 9.57 12.5 11.6 15.8 13.7 11.38 11.56
MKT 0.443*** 0.275* 0.396*** 0.372** 0.382*** 0.358*** 0.389*** 0.371***
p <0.0001 0.010 0.000 0.001 0.000 0.001 0.0002 0.0005
Sen’s slope 0.020 0.011 0.019 0.017 0.016 0.016 0.020 0.016
Maximum Mean 25.3 25.99 27.8 19.3 26.8 29.2 27.31 28.25
MKT 0.422*** 0.117 0.308** 0.396*** 0.454*** 0.410*** 0.338** 0.349**
p <0.0001 0.278 0.004 0.000 <0.0001 0.000 0.001 0.001
Sen’s slope 0.024 0.009 0.021 0.018 0.022 0.026 0.021 0.021
Notes: *p<0.05; **p<0.01; ***p<0.001.
Abbreviation: MKT: Mann–Kendall trend.
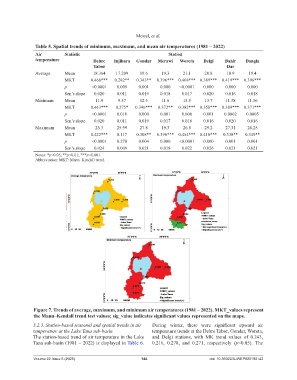
Figure 7. Trends of average, maximum, and minimum air temperatures (1981 – 2022). MKT_values represent
the Mann–Kendall trend test values; sig_value indicates significant values represented on the maps .
3.2.3. Station-based seasonal and spatial trends in air During winter, there were significant upward air
temperature at the Lake Tana sub-basin temperature trends at the Debre Tabor, Gondar, Woreta,
The station-based trend of air temperature in the Lake and Delgi stations, with MK trend values of 0.243,
Tana sub-basin (1981 – 2022) is displayed in Table 6. 0.216, 0.278, and 0.271, respectively (p<0.05). The
Volume 22 Issue 5 (2025) 144 doi: 10.36922/AJWEP025190142