Page 152 - AJWEP-22-5
P. 152

Messel, et al.

                                                                    causes of CO  emissions were industrial  combustion,
                                                                                 2
                                       Temperature
                                                                    transport, agriculture, fuel exploitation, waste, land use,
                                             -0.089
                                                                    and land-use changes.
                                                                                        [35]
                                          0.743
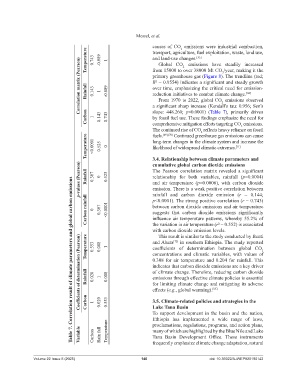
                                    Correlation matrix (Pearson)  Rainfall   0.143  1  -0.089  from 15000 to over 38000 Mt CO /year, making it the
                                                1
                                                                       Global  CO  emissions  have  steadily  increased
                                                                                  2
                                                                                                   2
                                                                    primary greenhouse gas (Figure 8). The trendline (red;
                                                                    R² = 0.9554) indicates a significant and steady growth
                                                                    over time, emphasizing the critical need for emission-
                                                                    reduction initiatives to combat climate change.
                                                                                                             [68]
                                                                       From 1970 to 2022, global CO  emissions observed
                                                                                                   2
                                                                    slope:  448.260;  p<0.0001) (Table  7),  primarily  driven
                                       Carbon   1  0.143  0.743     a significant sharp increase (Kendall’s tau: 0.956; Sen’s
                                                                    by fossil fuel use. These findings emphasize the need for
                                                                    comprehensive mitigation efforts targeting CO  emissions.
                                                                                                           2
                                                                    The continued rise of CO  reflects heavy reliance on fossil
                                                                                         2
                                                                              Continued greenhouse gas emissions can cause
                                                                    fuels.
                                       Temperature   <0.0001  0.525  0  long-term changes in the climate system and increase the
                                                                         [69],[70]
                                                                    likelihood of widespread climatic extremes.
                                                                                                         [71]
                                                                    3.4. Relationship between climate parameters and
                                    p‑values (Pearson)  Rainfall   0.307  0  0.525  cumulative global carbon dioxide emissions
                                                                    The  Pearson  correlation  matrix  revealed  a  significant
                                                                    relationship  for both variables,  rainfall  (p=0.0004)
                                 Table 7. Correlation result of climate parameters and global carbon emissions
                                                                    and air temperature  (p=0.0006), with carbon dioxide
                                                                    emission. There is a weak positive correlation between
                                                                    rainfall  and  carbon  dioxide  emission  (r =  0.144;
                                       Carbon rainfall   0  0.307  <0.0001  p<0.0001). The strong positive correlation (r = 0.743)

                                                                    between carbon dioxide emissions and air temperature
                                                                    suggests  that  carbon  dioxide  emissions  significantly
                                                                    influence air temperature patterns, whereby  55.2%  of
                                                                    the variation in air temperature (r² = 0.552) is associated
                                                                    with carbon dioxide emission levels.            2
                                                                       This result is similar to the study conducted by Benti
                                       Temperature
                                    Coefficients of determination (Pearson)  Rainfall   0.020  1  0.008  concentrations  and climatic  variables,  with values  of
                                                                    and Abara  in southern Ethiopia. The study reported
                                                                             [72]
                                             0.008
                                          0.553
                                                                    coefficients  of  determination  between  global  CO
                                                1
                                                                    0.308 for air temperature and 0.204 for rainfall. This
                                                                    indicates that carbon dioxide emissions are a key driver
                                                                    of climate change. Therefore, reducing carbon dioxide
                                                                    emissions through effective climate policies is essential
                                                                    for limiting climate change and mitigating its adverse
                                                                    effects (e.g., global warming).
                                                                                               [65]
                                       Carbon
                                                0.553
                                             0.020
                                                                    3.5. Climate‑related policies and strategies in the
                                          1
                                                                    Lake Tana Basin
                                                                    To support development  in the basin and the nation,
                                                                    Ethiopia  has implemented  a wide range of laws,
                                                                    proclamations, regulations, programs, and action plans,
                                    Variable   Carbon  Rain fall  Temperature  many of which are highlighted by the Blue Nile and Lake
                                                                    Tana  Basin  Development  Office.  These  instruments
                                                                    frequently emphasize climate change adaptation, natural


                Volume 22 Issue 5 (2025)                       146                           doi: 10.36922/AJWEP025190142
   147   148   149   150   151   152   153   154   155   156   157