
Page 149 - AJWEP-22-5
P. 149
Climate trend and policy in Lake Tana Basin
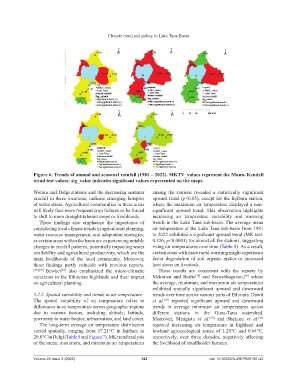
Figure 6. Trends of annual and seasonal rainfall (1981 – 2022). MKTV_values represent the Mann–Kendall
trend test values; sig_value indicates significant values represented on the maps.
Woreta and Delgi stations and the decreasing summer among the stations revealed a statistically significant
rainfall in these locations, indicate emerging hotspots upward trend (p<0.05), except for the Injibara station,
of water stress. Agricultural communities in these areas where the maximum air temperature displayed a non-
will likely face more frequent crop failures or be forced significant upward trend. This observation highlights
to shift to more drought-tolerant crops or livelihoods. increasing air temperature variability and warming
These findings also emphasize the importance of trends in the Lake Tana sub-basin. The average mean
considering local climate trends in agricultural planning, air temperature at the Lake Tana sub-basin from 1981
water resource management, and adaptation strategies, to 2022 exhibited a significant upward trend (MK test:
as certain areas within the basin are experiencing notable 0.526; p<0.0001) for almost all the stations, suggesting
changes in rainfall patterns, potentially impacting water rising air temperatures over time (Table 5). As a result,
availability and agricultural productivity, which are the certain areas with more rapid warming might experience
main livelihoods of the local community. Moreover, faster degradation of soil organic matter or increased
these findings partly coincide with previous reports. heat stress on livestock.
[49],[57] Bewket also emphasized the micro-climatic These results are consistent with the reports by
[67]
[10]
variations in the Ethiopian highlands and their impact Mekonen and Berlie and Suryabhagavan, where
[56]
on agricultural planning. the average, minimum, and maximum air temperatures
exhibited spatially significant upward and downward
3.2.2. Spatial variability and trends in air temperature trends over time across various parts of Ethiopia. Dawit
The spatial variability of air temperature refers to et al. reported significant upward and downward
[63]
differences in air temperature across geographic regions trends in average minimum air temperatures across
due to various factors, including altitude, latitude, different stations in the Guna-Tana watershed.
proximity to water bodies, urbanization, and land cover. Moreover, Mengistu et al. and Shekuru et al.
[49]
[50]
The long-term average air temperature distribution reported increasing air temperature in highland and
varied spatially, ranging from 17.21°C in Injibara to lowland agroecological zones of 1.28°C and 0.64°C,
20.8°C in Delgi (Table 5 and Figure 7). MK trend analysis respectively, over three decades, negatively affecting
of the mean, maximum, and minimum air temperatures the livelihood of smallholder farmers.
Volume 22 Issue 5 (2025) 143 doi: 10.36922/AJWEP025190142