Page 212 - AJWEP-22-6
P. 212

Gerson, et al.

                                                                     Table 7. Cumulative removal efficiencies across the
                                                                     Kalobe waste stabilization pond treatment stages

                                                                     Parameter   Influent   Final effluent   Overall
                                                                                (anaerobic  (maturation   removal
                                                                                  inlet)     outlet)    efficiency (%)
                                                                     BOD 5        93.00       39.00         58.06
                                                                     COD         612.00       78.00         87.25
                                                                     TSS         320.00       41.00         87.19
                                                                     Ammonia      15.40       3.00          80.52
                                                                     (NH )
                                                                         3
                                                                     Nitrite      0.46        0.38          17.39
                                                                     (NO )
                                                                         2
                Figure 6. Maturation pond – stage-wise concentration   TDS       1,034.00    892.00         13.74
                and reduction                                        Abbreviations: BOD : Biochemical oxygen demand, 5-day;
                                                                                    5
                                                                     COD: Chemical oxygen demand; TDS: Total dissolved solids;
                                                                     TSS: Total suspended solids.
                                                                     Table 8. Daily industrial discharge flow data for
                                                                     April 2025
                                                                     Industry                  Total    Daily average
                                                                                             flow (m )     (m /d)
                                                                                                    3
                                                                                                             3
                                                                     Pepsi                    20,108       670.3
                                                                     Tanzania Breweries Limited  12,307    410.2
                                                                     Coca-Cola Kwanza          4,298       143.3


                                                                    treatment  under  mixed  municipal  and  industrial
                                                                    loading conditions. Organic matter removal was strong,
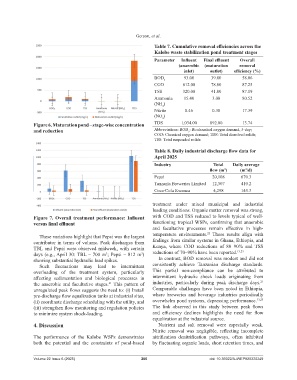
                Figure 7. Overall treatment performance: Influent   with COD and TSS reduced to levels typical of well-
                versus final effluent                               functioning  tropical WSPs,  confirming  that  anaerobic
                                                                    and  facultative  processes  remain  effective  in  high-
                                                                                            22
                  These variations highlight that Pepsi was the largest   temperature  environments.   These results align with
                contributor in terms of volume. Peak discharges from   findings from similar systems in Ghana, Ethiopia, and
                TBL and Pepsi were observed midweek, with certain   Kenya,  where  COD  reductions  of  80–90%  and  TSS
                days (e.g., April 30: TBL – 700 m ; Pepsi – 812 m )   reductions of 70–90% have been reported. 13,23
                                                               3
                                                3
                showing substantial hydraulic load spikes.             In contrast, BOD removal was modest and did not
                  Such  fluctuations  may  lead  to  intermittent   consistently  achieve  Tanzanian  discharge standards.
                overloading of the treatment  system, particularly   This  partial  non-compliance  can  be  attributed  to
                affecting  sedimentation  and  biological  processes  in   intermittent  hydraulic  shock loads  originating  from
                                                                                                                    21
                the anaerobic and facultative stages.  This pattern of   industries, particularly  during peak discharge days.
                                                 21
                unregulated peak flows suggests the need to: (i) Install   Comparable  challenges  have  been  noted  in Ethiopia,
                pre-discharge flow equalization tanks at industrial sites,   where breweries and beverage  industries periodically
                (ii) coordinate discharge scheduling with the utility, and   overwhelm pond systems, depressing performance. 13,23
                (iii) strengthen flow monitoring and regulation policies   The  link  observed  in  this  study  between  peak  flows
                to minimize system shock-loading.                   and  efficiency  declines  highlights  the  need  for  flow
                                                                    equalization at the industrial source.
                4. Discussion                                          Nutrient and salt removal  were especially  weak.
                                                                    Nitrite  removal  was  negligible,  reflecting  incomplete
                The  performance  of  the  Kalobe  WSPs  demonstrates   nitrification–denitrification  pathways,  often  inhibited
                both  the  potential  and  the  constraints  of pond-based   by fluctuating organic loads, short retention times, and


                Volume 22 Issue 6 (2025)                       206                           doi: 10.36922/AJWEP025320249
   207   208   209   210   211   212   213   214   215   216   217