
Page 208 - AJWEP-22-6
P. 208
Gerson, et al.
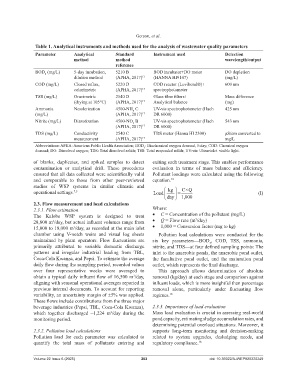
Table 1. Analytical instruments and methods used for the analysis of wastewater quality parameters
Parameter Analytical Standard Instrument used Detection
method method wavelength/output
reference
BOD (mg/L) 5-day incubation, 5210 B BOD incubator+DO meter DO depletion
5
dilution method (APHA, 2017) 17 (HANNA HI9147) (mg/L)
COD (mg/L) Closed reflux, 5220 D COD reactor (Lovibond®)+ 600 nm
colorimetric (APHA, 2017) 17 spectrophotometer
TSS (mg/L) Gravimetric 2540 D Glass fiber filters+ Mass difference
(drying at 105°C) (APHA, 2017) 17 Analytical balance (mg)
Ammonia Nesslerization 4500-NH C UV-vis spectrophotometer (Hach 425 nm
3
(mg/L) (APHA, 2017) 17 DR 6000)
Nitrite (mg/L) Diazotization 4500-NO B UV-vis spectrophotometer (Hach 543 nm
2
(APHA, 2017) 17 DR 6000)
TDS (mg/L) Conductivity 2540 C TDS meter (Hanna HI 2300) μS/cm converted to
measurement (APHA, 2017) 17 mg/L
Abbreviations: APHA: American Public Health Association; BOD : Biochemical oxygen demand, 5-day; COD: Chemical oxygen
5
demand; DO: Dissolved oxygen; TDS: Total dissolved solids; TSS: Total suspended solids; UV-vis: Ultraviolet–visible light.
of blanks, duplicates, and spiked samples to detect exiting each treatment stage. This enables performance
contamination or analytical drift. These procedures evaluation in terms of mass balance and efficiency.
ensured that all data collected were scientifically valid Pollutant loadings were calculated using the following
and comparable to those from other peer-reviewed equation. 18
studies of WSP systems in similar climatic and
operational settings. 7,5 Load kg = C×Q (I)
day 1,000
2.3. Flow measurement and load calculations
2.3.1. Flow estimation Where:
The Kalobe WSP system is designed to treat • C = Concentration of the pollutant (mg/L)
3
28,800 m /day, but actual influent volumes range from • Q = Flow rate (m /day)
3
15,000 to 18,000 m /day, as recorded at the main inlet • 1,000 = Conversion factor (mg to kg)
3
chamber using V-notch weirs and visual log sheets Pollution load calculations were conducted for the
maintained by plant operators. Flow fluctuations are six key parameters—BOD , COD, TSS, ammonia,
5
primarily attributed to variable domestic discharge nitrite, and TDS—at four defined sampling points: The
patterns and irregular industrial loading from TBL, inlet to the anaerobic ponds, the anaerobic pond outlet,
Coca-Cola Kwanza, and Pepsi. To estimate the average the facultative pond outlet, and the maturation pond
daily flow during the sampling period, recorded values outlet, which represents the final discharge.
over four representative weeks were averaged to This approach allows determination of absolute
obtain a typical daily influent flow of 16,500 m /day, removal (kg/day) at each stage and comparison against
3
aligning with seasonal operational averages reported in influent loads, which is more insightful than percentage
previous internal documents. To account for reporting removal alone, particularly under fluctuating flow
variability, an uncertainty margin of ±5% was applied. regimes. 18
These flows include contributions from the three major
beverage industries (Pepsi, TBL, Coca-Cola Kwanza), 2.3.3. Importance of load evaluation
which together discharged ~1,224 m /day during the Mass load evaluation is crucial in assessing real-world
3
monitoring period. pond capacity, estimating sludge accumulation rates, and
determining potential overload situations. Moreover, it
2.3.2. Pollution load calculations supports long-term monitoring and decision-making
Pollution load for each parameter was calculated to related to system upgrades, desludging needs, and
quantify the total mass of pollutants entering and regulatory compliance. 18
Volume 22 Issue 6 (2025) 202 doi: 10.36922/AJWEP025320249