
Page 210 - AJWEP-22-6
P. 210
Gerson, et al.
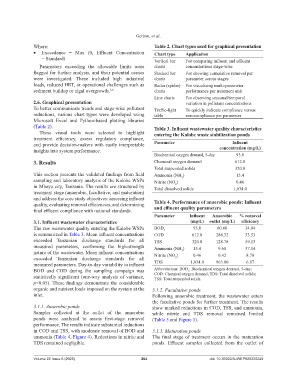
Where: Table 2. Chart types used for graphical presentation
• Exceedance = Max (0, Effluent Concentration Chart type Application
− Standard) Vertical bar For comparing influent and effluent
Parameters exceeding the allowable limits were charts concentrations stage-wise
flagged for further analysis, and their potential causes Stacked bar For showing cumulative removal per
were investigated. These included high industrial charts parameter across stages
loads, reduced HRT, or operational challenges such as Radar (spider) For visualizing multi-parameter
sediment buildup or algal overgrowth. 5,6 charts performance per treatment unit
Line charts For observing seasonal/temporal
2.6. Graphical presentation variation in pollutant concentrations
To better communicate trends and stage-wise pollutant Traffic-light To quickly indicate compliance versus
reductions, various chart types were developed using table non-compliance per parameter
Microsoft Excel and Python-based plotting libraries
(Table 2). Table 3. Influent wastewater quality characteristics
These visual tools were selected to highlight entering the Kalobe waste stabilization ponds
treatment efficiency, assess regulatory compliance,
and provide decision-makers with easily interpretable Parameter Influent
insights into system performance. concentration (mg/L)
Biochemical oxygen demand, 5-day 93.0
3. Results Chemical oxygen demand 612.0
Total suspended solids 320.0
This section presents the validated findings from field Ammonia (NH ) 15.4
sampling and laboratory analysis of the Kalobe WSPs Nitrite (NO ) 3 0.46
2
in Mbeya city, Tanzania. The results are structured by Total dissolved solids 1,034.0
treatment stage (anaerobic, facultative, and maturation)
and address the core study objectives: assessing influent
quality, evaluating removal efficiencies, and determining Table 4. Performance of anaerobic ponds: Influent
final effluent compliance with national standards. and effluent quality parameters
Parameter Influent Anaerobic % removal
3.1. Influent wastewater characteristics (mg/L) outlet (mg/L) efficiency
The raw wastewater quality entering the Kalobe WSPs BOD 5 93.0 60.60 34.84
is summarized in Table 3. Mean influent concentrations COD 612.0 284.32 53.53
exceeded Tanzanian discharge standards for all TSS 320.0 128.78 59.13
measured parameters, confirming the high-strength Ammonia (NH ) 15.4 9.68 37.14
nature of the wastewater. Mean influent concentrations Nitrite (NO ) 3 0.46 0.42 8.70
exceeded Tanzanian discharge standards for all 2
measured parameters. Day-to-day variability in influent TDS 1,034.0 963.00 6.87
BOD and COD during the sampling campaign was Abbreviations: BOD : Biochemical oxygen demand, 5-day;
5
statistically significant (one-way analysis of variance, COD: Chemical oxygen demand; TDS: Total dissolved solids;
TSS: Total suspended solids.
p<0.05). These findings demonstrate the considerable
organic and nutrient loads imposed on the system at the 3.1.2. Facultative ponds
inlet. Following anaerobic treatment, the wastewater enters
the facultative ponds for further treatment. The results
3.1.1. Anaerobic ponds show marked reductions in COD, TSS, and ammonia,
Samples collected at the outlet of the anaerobic while nitrite and TDS removal remained limited
ponds were analyzed to assess first-stage removal (Table 5 and Figure 5).
performance. The results indicate substantial reductions
in COD and TSS, with moderate removal of BOD and 3.1.3. Maturation ponds
ammonia (Table 4, Figure 4). Reductions in nitrite and The final stage of treatment occurs in the maturation
TDS remained negligible. ponds. Effluent samples collected from the outlet of
Volume 22 Issue 6 (2025) 204 doi: 10.36922/AJWEP025320249