
Page 81 - {PDF Title}
P. 81
Water quality and health risks
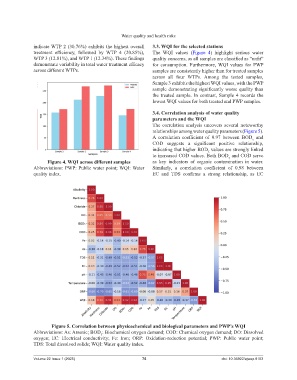
indicate WTP 2 (30.76%) exhibits the highest overall 3.3. WQI for the selected stations
treatment efficiency, followed by WTP 4 (20.85%), The WQI values (Figure 4) highlight serious water
WTP 3 (12.81%), and WTP 1 (12.34%). These findings quality concerns, as all samples are classified as “unfit”
demonstrate variability in total water treatment efficacy for consumption. Furthermore, WQI values for PWP
across different WTPs. samples are consistently higher than for treated samples
across all four WTPs. Among the tested samples,
Sample 3 exhibits the highest WQI values, with the PWP
sample demonstrating significantly worse quality than
the treated sample. In contrast, Sample 4 records the
lowest WQI values for both treated and PWP samples.
3.4. Correlation analysis of water quality
parameters and the WQI
The correlation analysis uncovers several noteworthy
relationships among water quality parameters (Figure 5).
A correlation coefficient of 0.97 between BOD and
5
COD suggests a significant positive relationship,
indicating that higher BOD values are strongly linked
5
to increased COD values. Both BOD and COD serve
5
Figure 4. WQI across different samples as key indicators of organic contamination in water.
Abbreviations: PWP: Public water point; WQI: Water Similarly, a correlation coefficient of 0.98 between
quality index. EC and TDS confirms a strong relationship, as EC
Figure 5. Correlation between physicochemical and biological parameters and PWP’s WQI
Abbreviations: As: Arsenic; BOD : Biochemical oxygen demand; COD: Chemical oxygen demand; DO: Dissolved
5
oxygen; EC: Electrical conductivity; Fe: Iron; ORP: Oxidation-reduction potential; PWP: Public water point;
TDS: Total dissolved solids; WQI: Water quality index.
Volume 22 Issue 1 (2025) 75 doi: 10.36922/ajwep.8163