
Page 79 - {PDF Title}
P. 79
Water quality and health risks
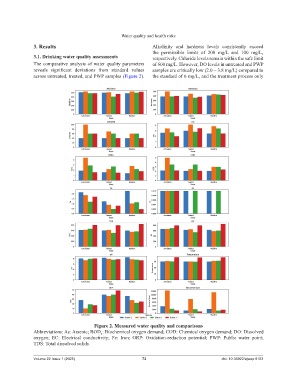
3. Results Alkalinity and hardness levels consistently exceed
the permissible limits of 200 mg/L and 100 mg/L,
3.1. Drinking water quality assessments respectively. Chloride levels remain within the safe limit
The comparative analysis of water quality parameters of 600 mg/L. However, DO levels in untreated and PWP
reveals significant deviations from standard values samples are critically low (2.0 – 3.8 mg/L) compared to
across untreated, treated, and PWP samples (Figure 2). the standard of 6 mg/L, and the treatment process only
Figure 2. Measured water quality and comparisons
Abbreviations: As: Arsenic; BOD : Biochemical oxygen demand; COD: Chemical oxygen demand; DO: Dissolved
5
oxygen; EC: Electrical conductivity; Fe: Iron; ORP: Oxidation-reduction potential; PWP: Public water point;
TDS: Total dissolved solids.
Volume 22 Issue 1 (2025) 73 doi: 10.36922/ajwep.8163