
Page 82 - {PDF Title}
P. 82
Hossain, et al.
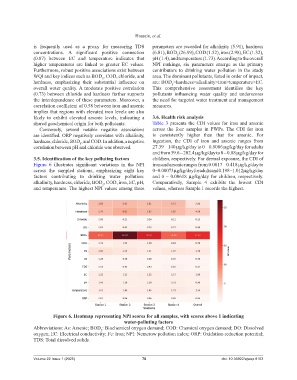
is frequently used as a proxy for measuring TDS parameters are recorded for alkalinity (5.91), hardness
concentrations. A significant positive connection (6.81), BOD (26.99), COD (1.52), iron (2.98), EC (1.32),
5
(0.87) between EC and temperature indicates that pH (1.4), and temperature (1.73). According to the overall
higher temperatures are linked to greater EC values. NPI rankings, six parameters emerge as the primary
Furthermore, robust positive associations exist between contributors to drinking water pollution in the study
WQI and key indices such as BOD , COD, chloride, and area. The dominant pollutants, listed in order of impact,
5
hardness, emphasizing their substantial influence on are: BOD >hardness>alkalinity>iron>temperature>EC.
5
overall water quality. A moderate positive correlation This comprehensive assessment identifies the key
(0.73) between chloride and hardness further supports pollutants influencing water quality and underscores
the interdependence of these parameters. Moreover, a the need for targeted water treatment and management
correlation coefficient of 0.58 between iron and arsenic measures.
implies that regions with elevated iron levels are also
likely to exhibit elevated arsenic levels, indicating a 3.6. Health risk analysis
shared geochemical origin for both pollutants. Table 3 presents the CDI values for iron and arsenic
Conversely, several notable negative associations across the four samples in PWPs. The CDI for iron
are identified. ORP negatively correlates with alkalinity, is consistently higher than that for arsenic. For
hardness, chloride, BOD , and COD. In addition, a negative ingestion, the CDI of iron and arsenic ranges from
5
correlation between pH and chloride was observed. 27.39 – 140 µg/kg/day to 0 – 0.6086 µg/kg/day for adults
and from 39.6 – 202.4 µg/kg/day to 0 – 0.88 µg/kg/day for
3.5. Identification of the key polluting factors children, respectively. For dermal exposure, the CDI of
Figure 6 illustrates significant variations in the NPI iron and arsenic ranges from 0.0817 – 0.418 µg/kg/day to
across the sampled stations, emphasizing eight key 0 – 0.00073 µg/kg/day for adults and 0.198 – 1.012 µg/kg/day
factors contributing to drinking water pollution: and 0 – 0.00618 µg/kg/day for children, respectively.
alkalinity, hardness, chloride, BOD , COD, iron, EC, pH, Comparatively, Sample 4 exhibits the lowest CDI
5
and temperature. The highest NPI values among these values, whereas Sample 1 records the highest.
Figure 6. Heatmap representing NPI scores for all samples, with scores above 1 indicating
water-polluting factors
Abbreviations: As: Arsenic; BOD : Biochemical oxygen demand; COD: Chemical oxygen demand; DO: Dissolved
5
oxygen; EC: Electrical conductivity; Fe: Iron; NPI: Nemerow pollution index; ORP: Oxidation-reduction potential;
TDS: Total dissolved solids.
Volume 22 Issue 1 (2025) 76 doi: 10.36922/ajwep.8163